Redesigning Internal Tool for Product Data Retrieval and Client Order Tracking

During my internship at Brilltek, a software company serving the manufacturing industry, I worked on a client project to redesign an internal tool used for tracking production data. The redesign focused on improving usability of production data retrieval and meeting new business requirements by allowing external customers to log in and track their order status.

My Role

My Role

  • Collaborated with stakeholders to align business needs and user goals

  • Conducted product audit and analyzed existing user flows to identify pain points

  • Presented and iterated on design solutions based on stakeholder feedback

  • Delivered wireframes & high-fidelity prototypes

  • Collaborated with stakeholders to align business needs and user goals

  • Conducted product audit and analyzed existing user flows to identify pain points

  • Presented and iterated on design solutions based on stakeholder feedback

  • Delivered wireframes & high-fidelity prototypes

Impact

Designed a MVP approved by the internal team, ready for implementation in future development.

Achievements

Designed a MVP approved by the internal team, ready for implementation in future development.

TEAM

TEAM

1 Product Manager

2 External Stakeholders (CEO & Engineer)

1 Product Manager

2 External Stakeholders (CEO & Engineer)

COMPANY

CLIENT

Brilltelk

Client: Finepro Automation

FCS(Machinery Manufacture)

DURATION

DURATION

4 weeks, 2023 May

4 weeks, 2023 May

TOOLS

TOOLS

Figma

Figma

DISCOVERY - STAKEHOLDER NEEDS

DISCOVERY - STAKEHOLDER NEEDS

Stakeholder Alignment & Problem Understanding

Look into the Tool -

Information Architecture

X User Flow

CHALLENGE

Dealing with conflicting user stories from two stakeholder meetings

Dealing with conflicting user stories from two stakeholder meetings

1st Meeting

Engineer Manager

We want our product for

Salesperson to Showcase Product to the Clients

Internal Workers to Trace Data for Manufacturing Products

2nd Meeting

CEO

We want our product for

Clients to Track and Retrieve their Order Status and Details

Internal Workers to Trace Data for Manufacturing Products

WHAT I LEARNED

Recaps help validate early-stage goals and identify misalignment

Recaps help validate early-stage goals and identify misalignment

Recapping key decisions from previous meetings helped stakeholders identify misaligned expectations early and ensured the team stayed on the same page.

Recapping key decisions from previous meetings helped stakeholders identify misaligned expectations early and ensured the team stayed on the same page.

HOW I SOLVED

Shared updated user stories and task flows for quick alignment

Shared updated user stories and task flows for quick alignment

After the second meeting, I revised the user stories and visualized updated task flows. These helped stakeholders quickly confirm direction and spot inconsistencies before moving forward.

After the second meeting, I revised the user stories and visualized updated task flows. These helped stakeholders quickly confirm direction and spot inconsistencies before moving forward.

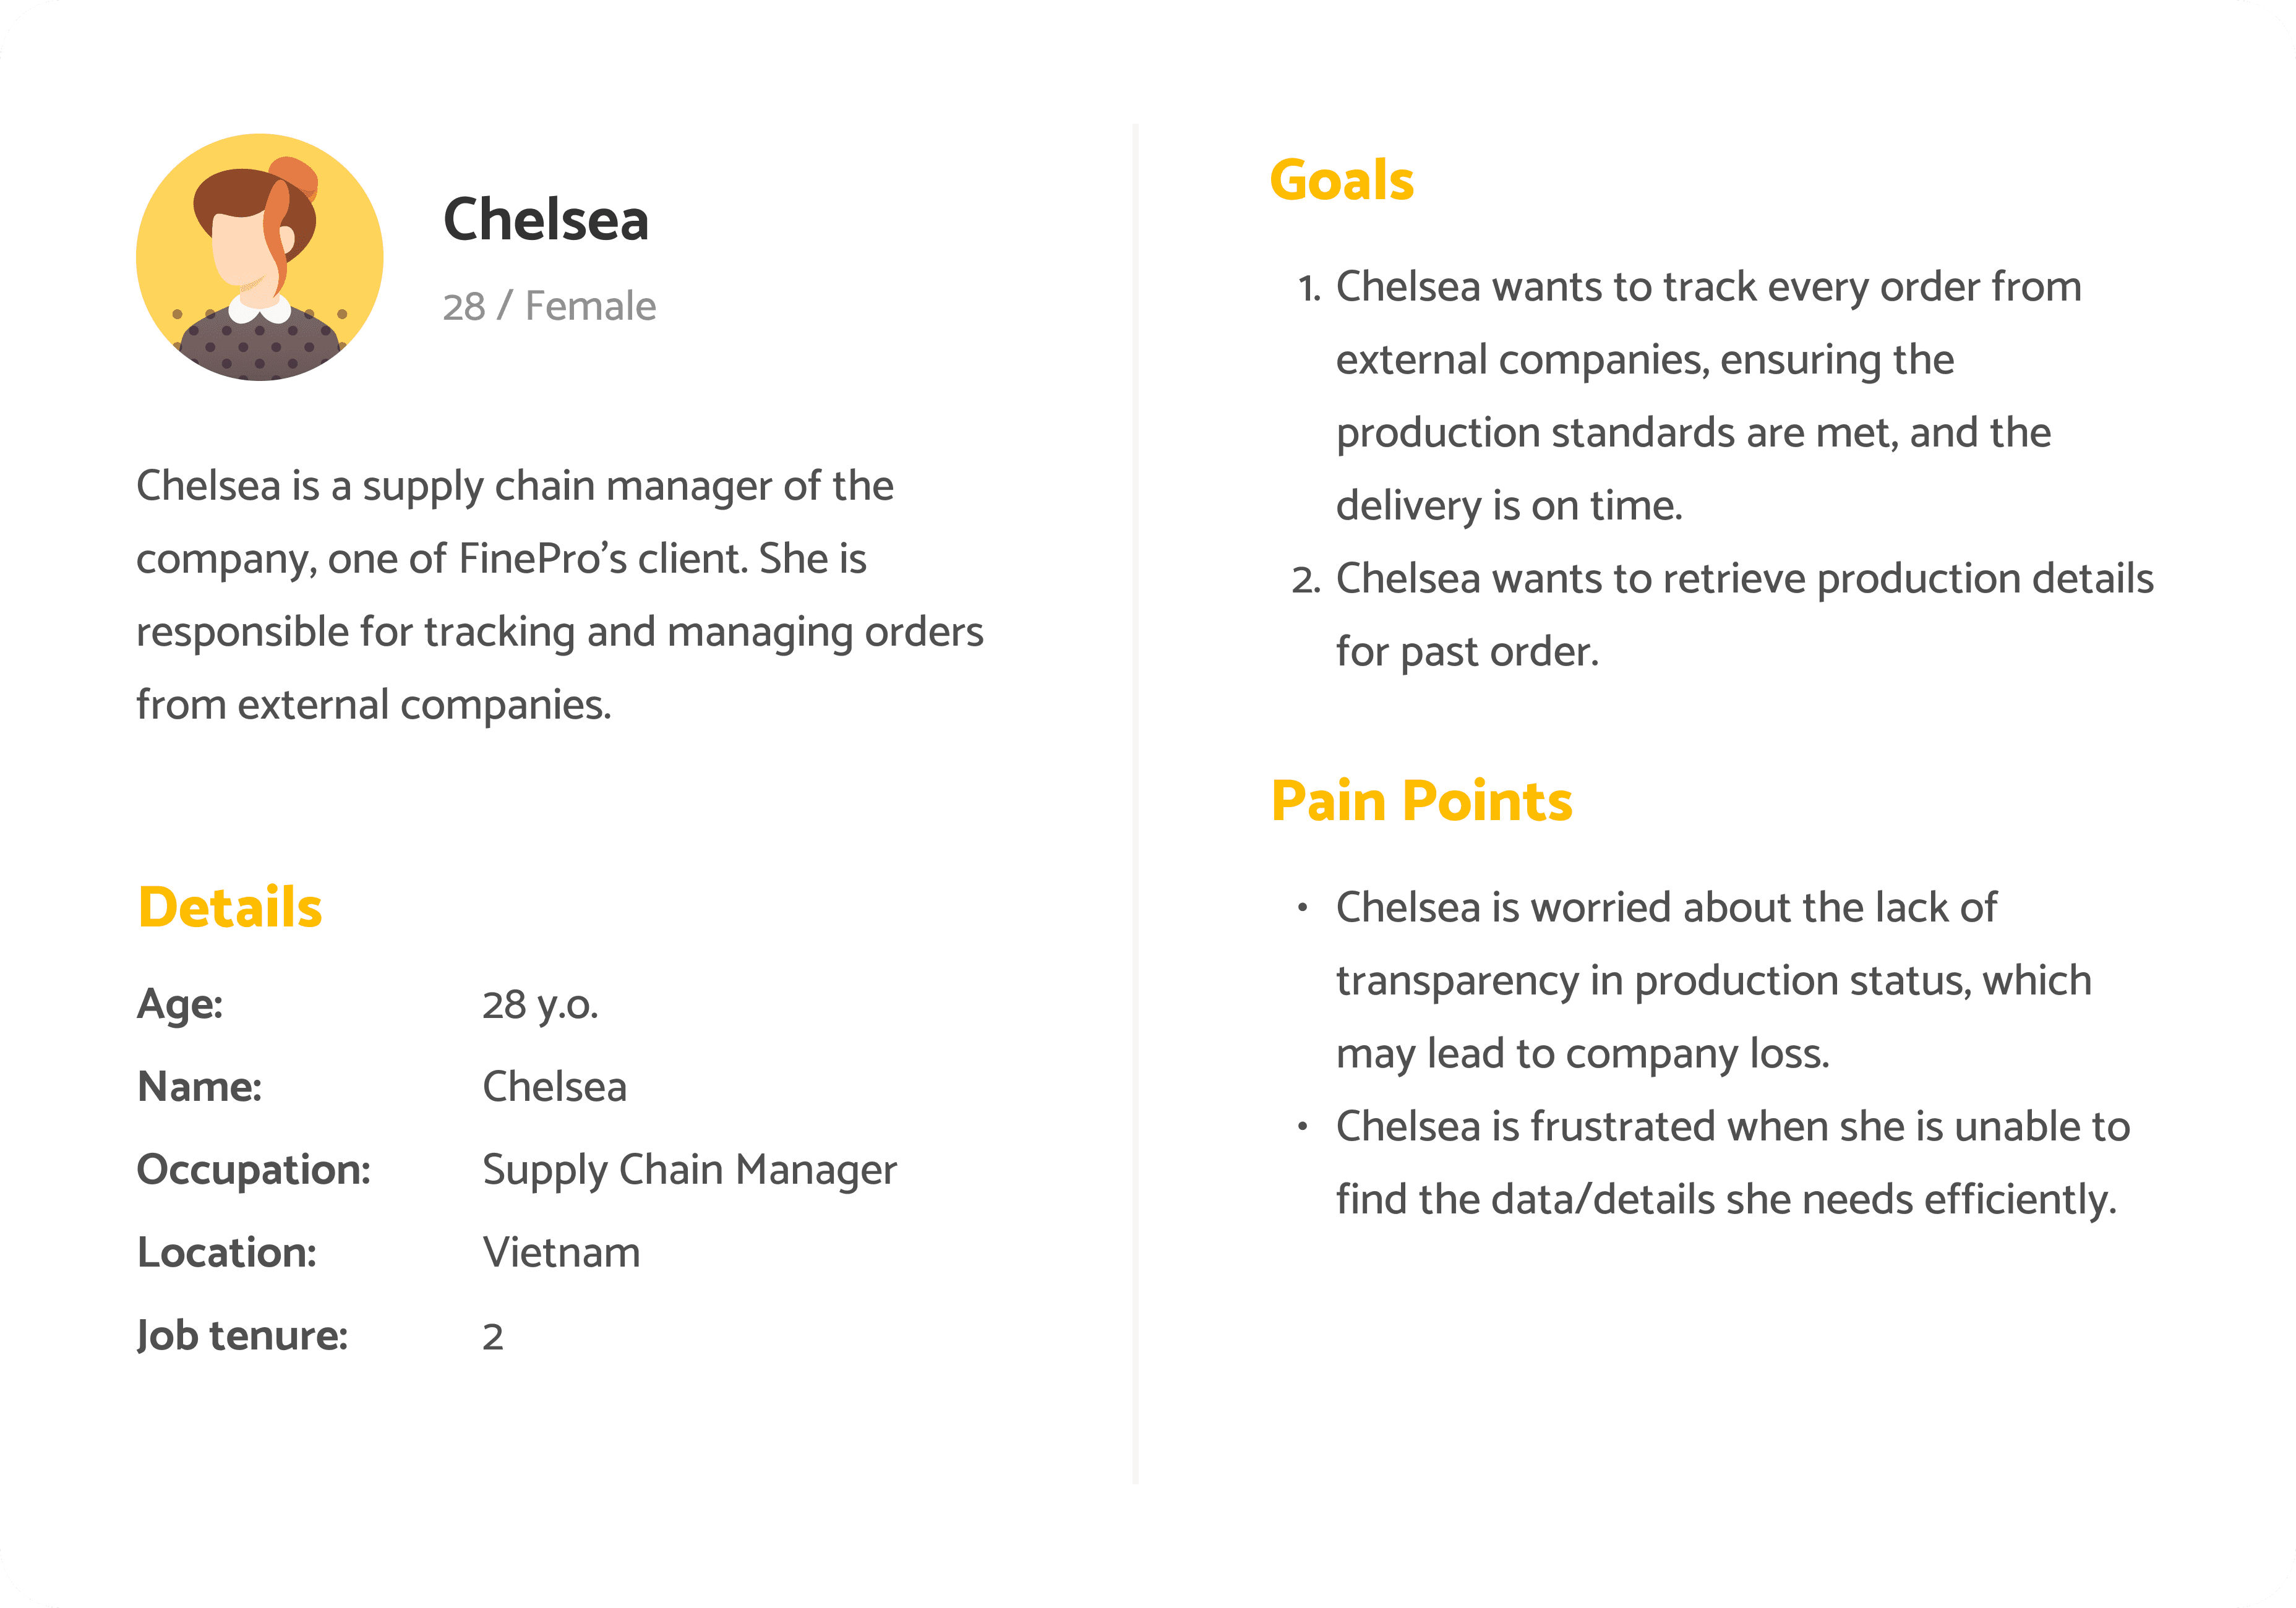
As a client, I want to view my order status and check if the production process meets standards.

Two scenarios:

  • Login to view an overview of my orders

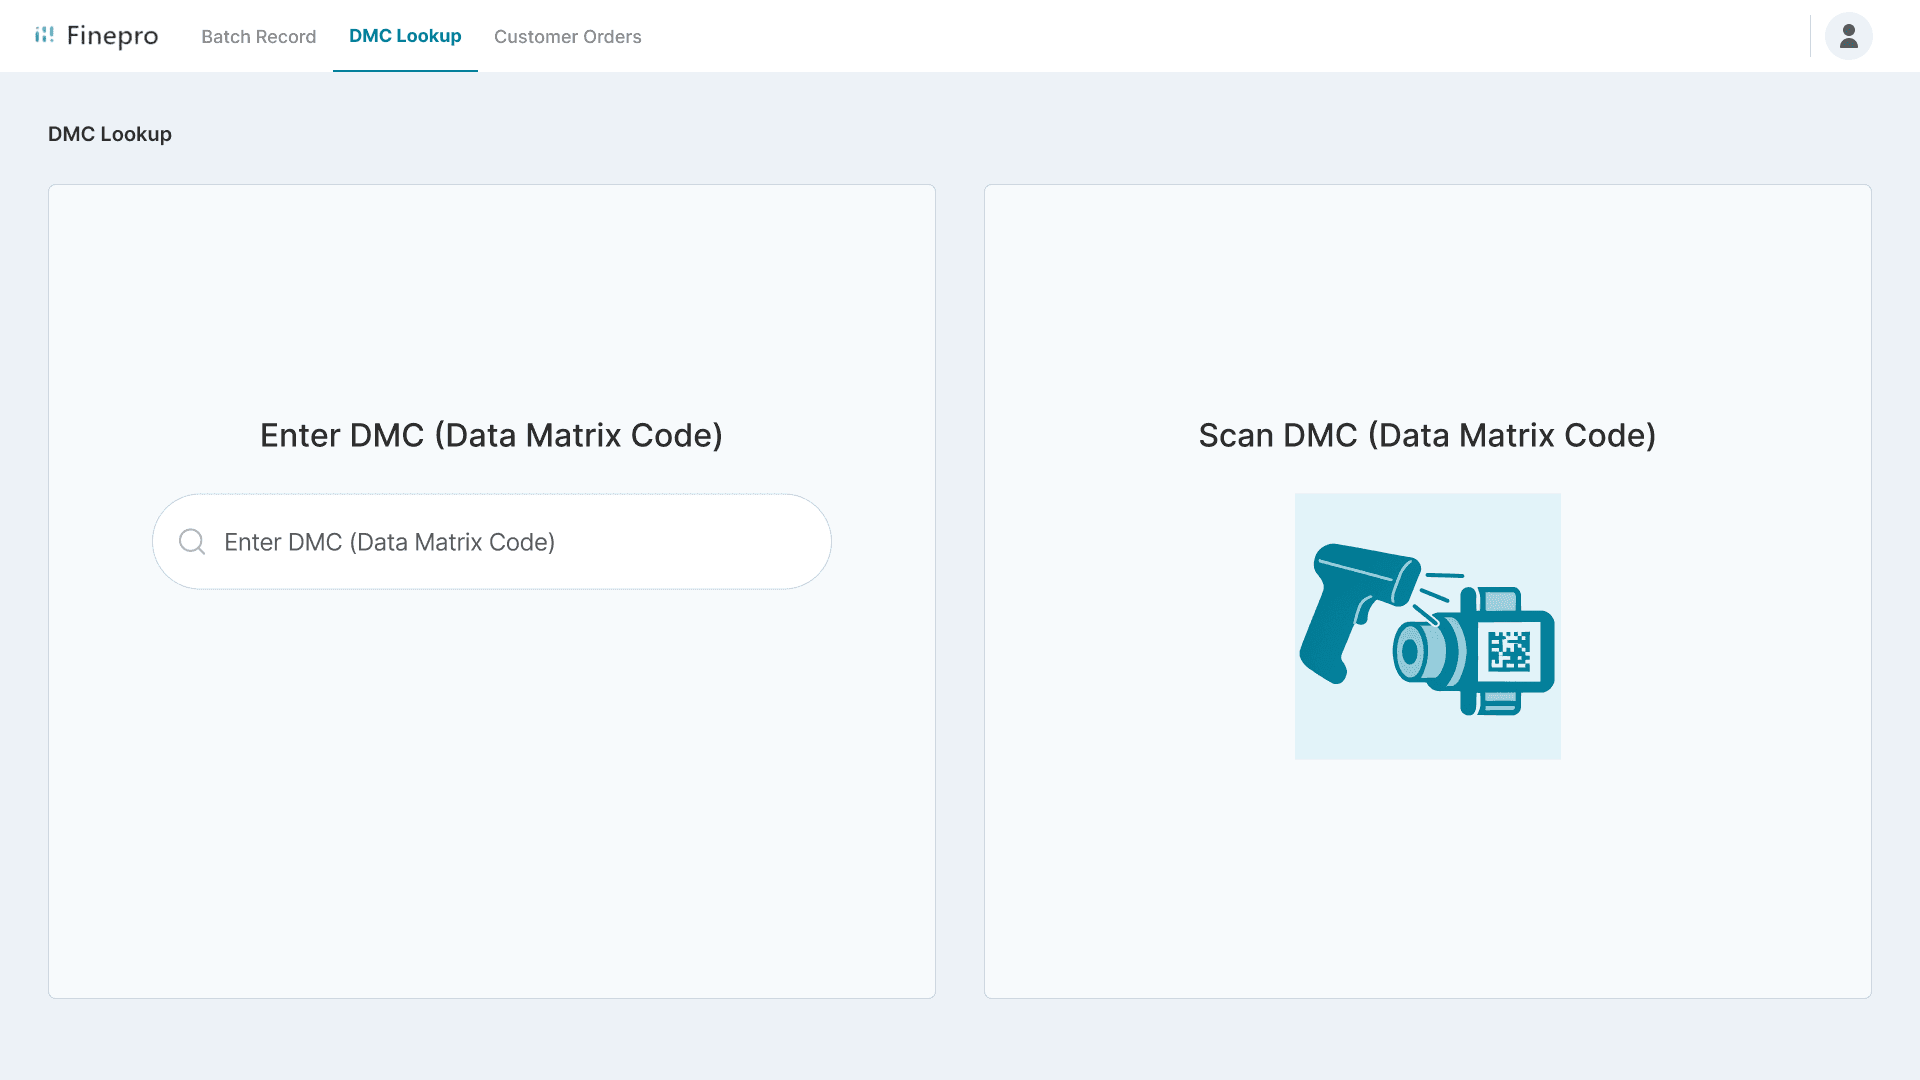
  • Scan the DMC code to trace production records

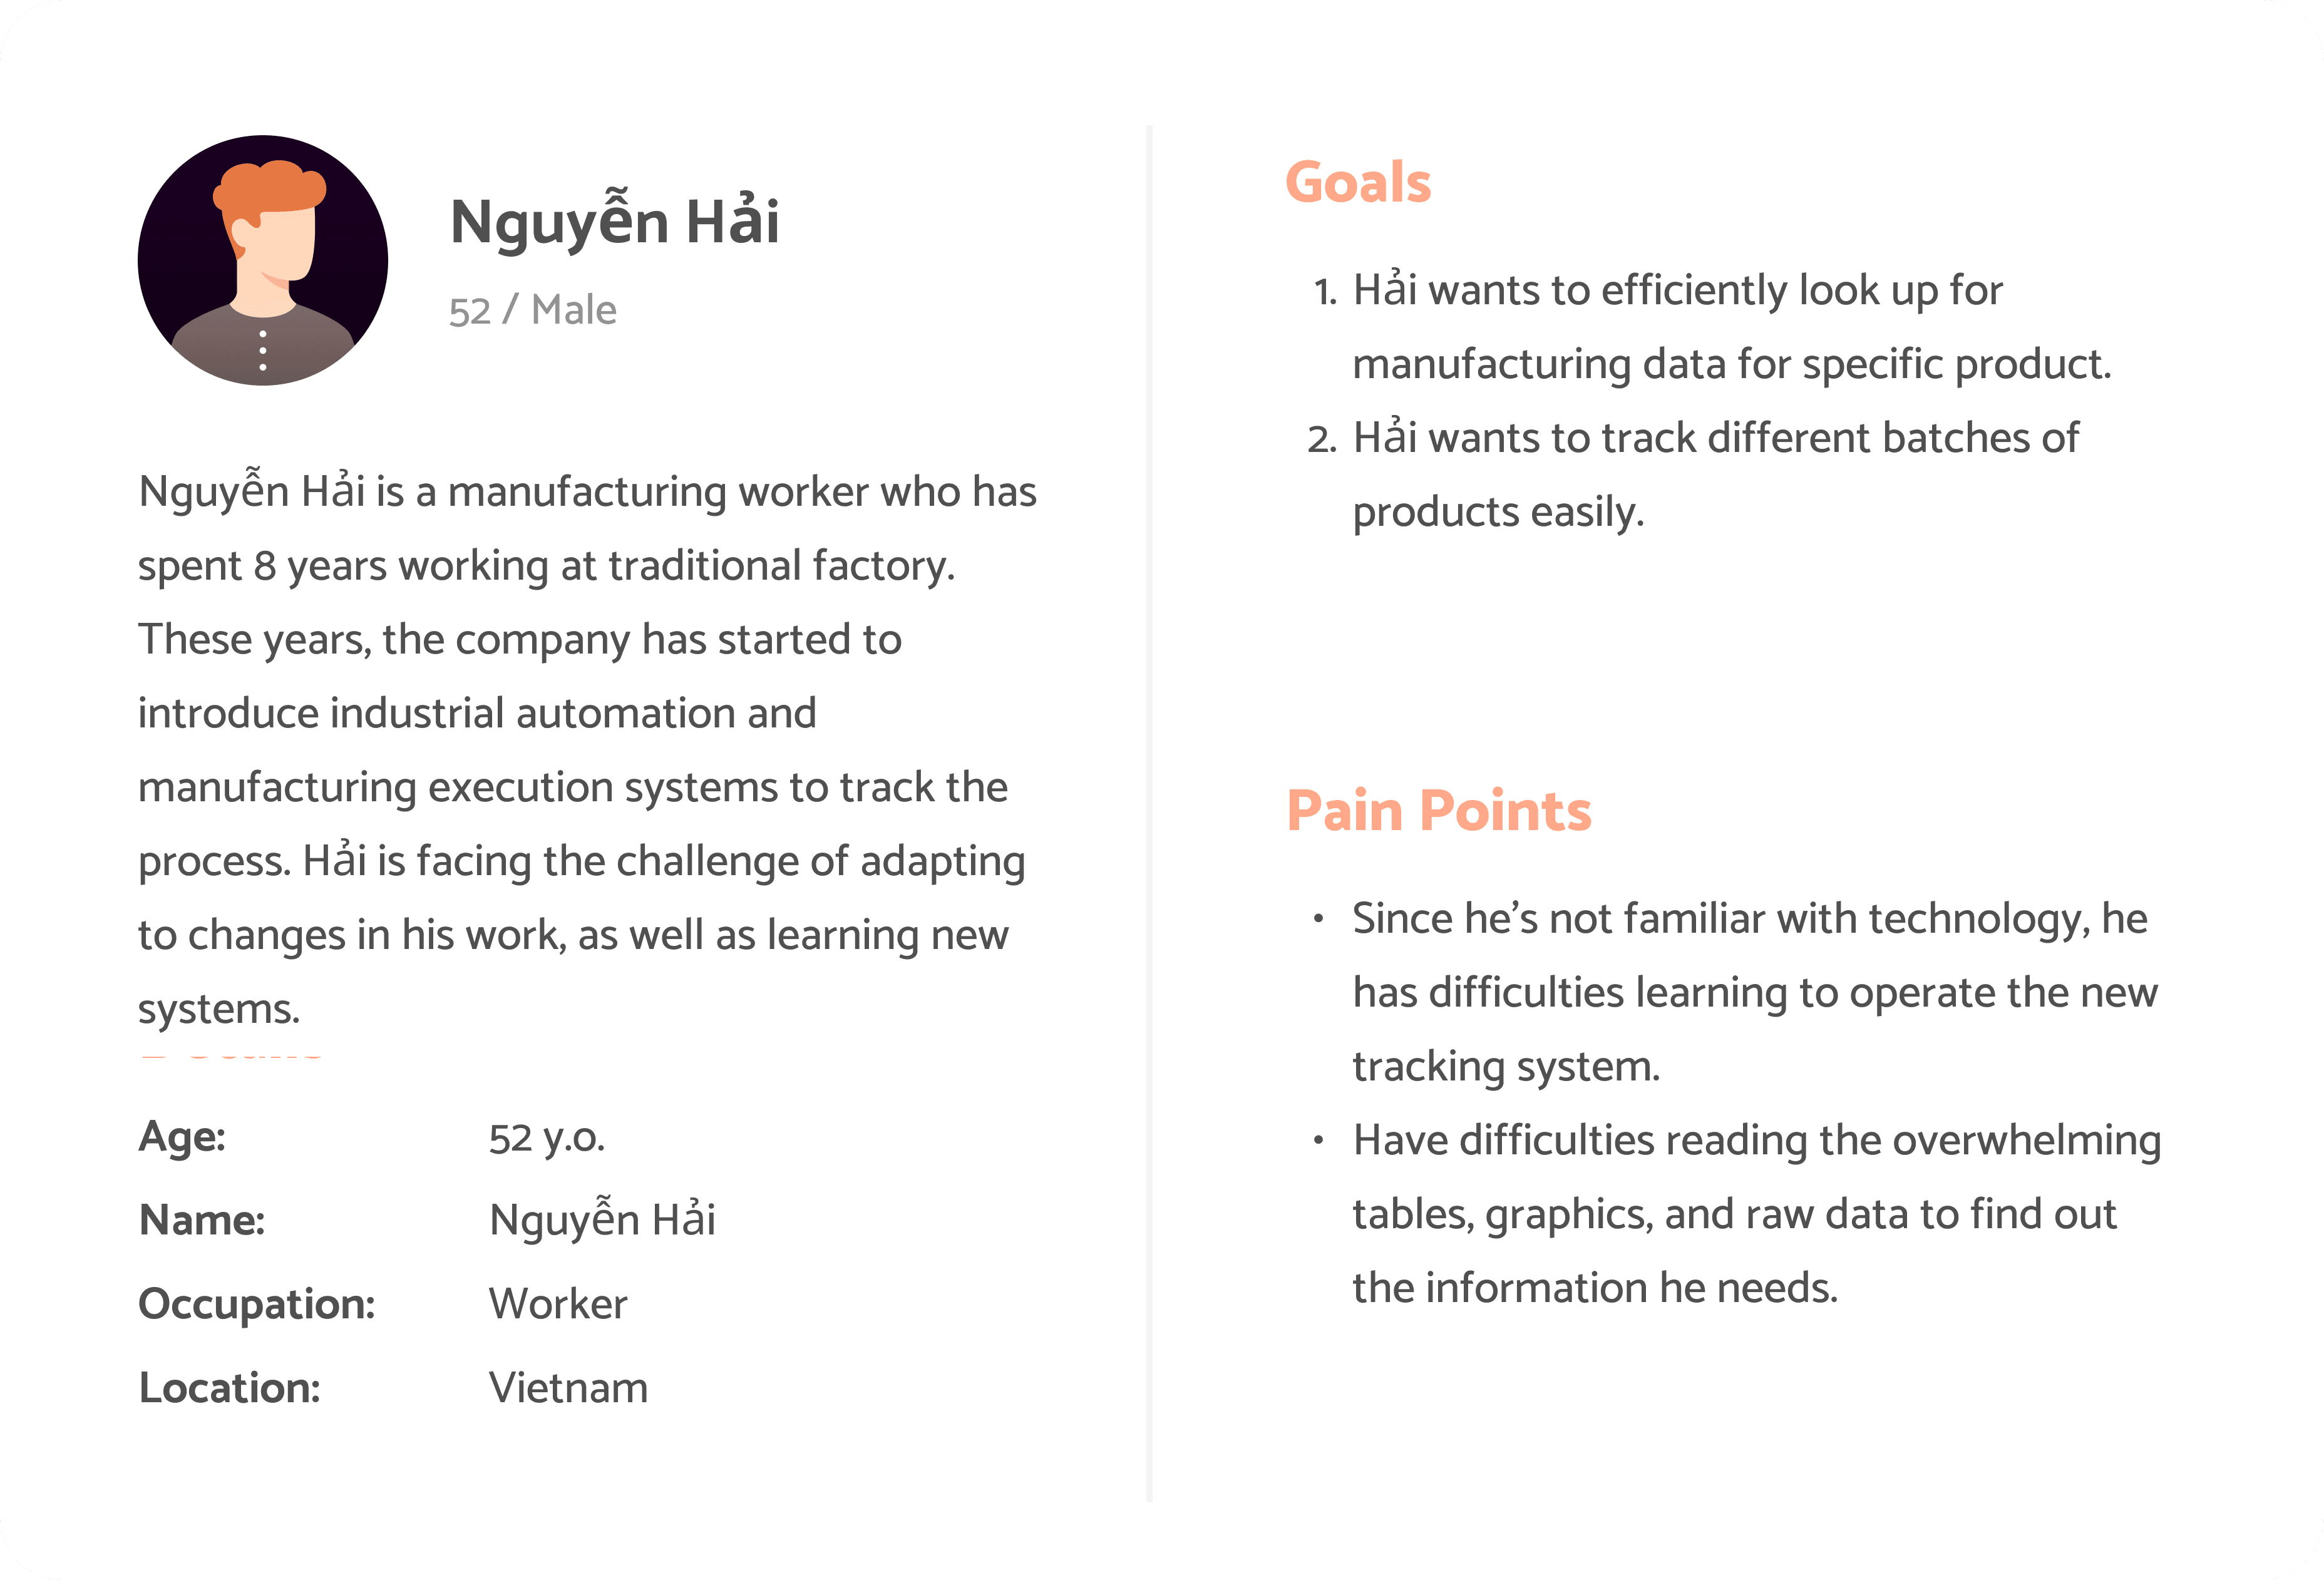
As an internal worker, I want to look up product manufacturing record efficiently.

OUTCOME - USER STORY

PROJECT GOAL

Redesign the tool to improve usability for internal production data tracking and meet new business goal for external client order tracking

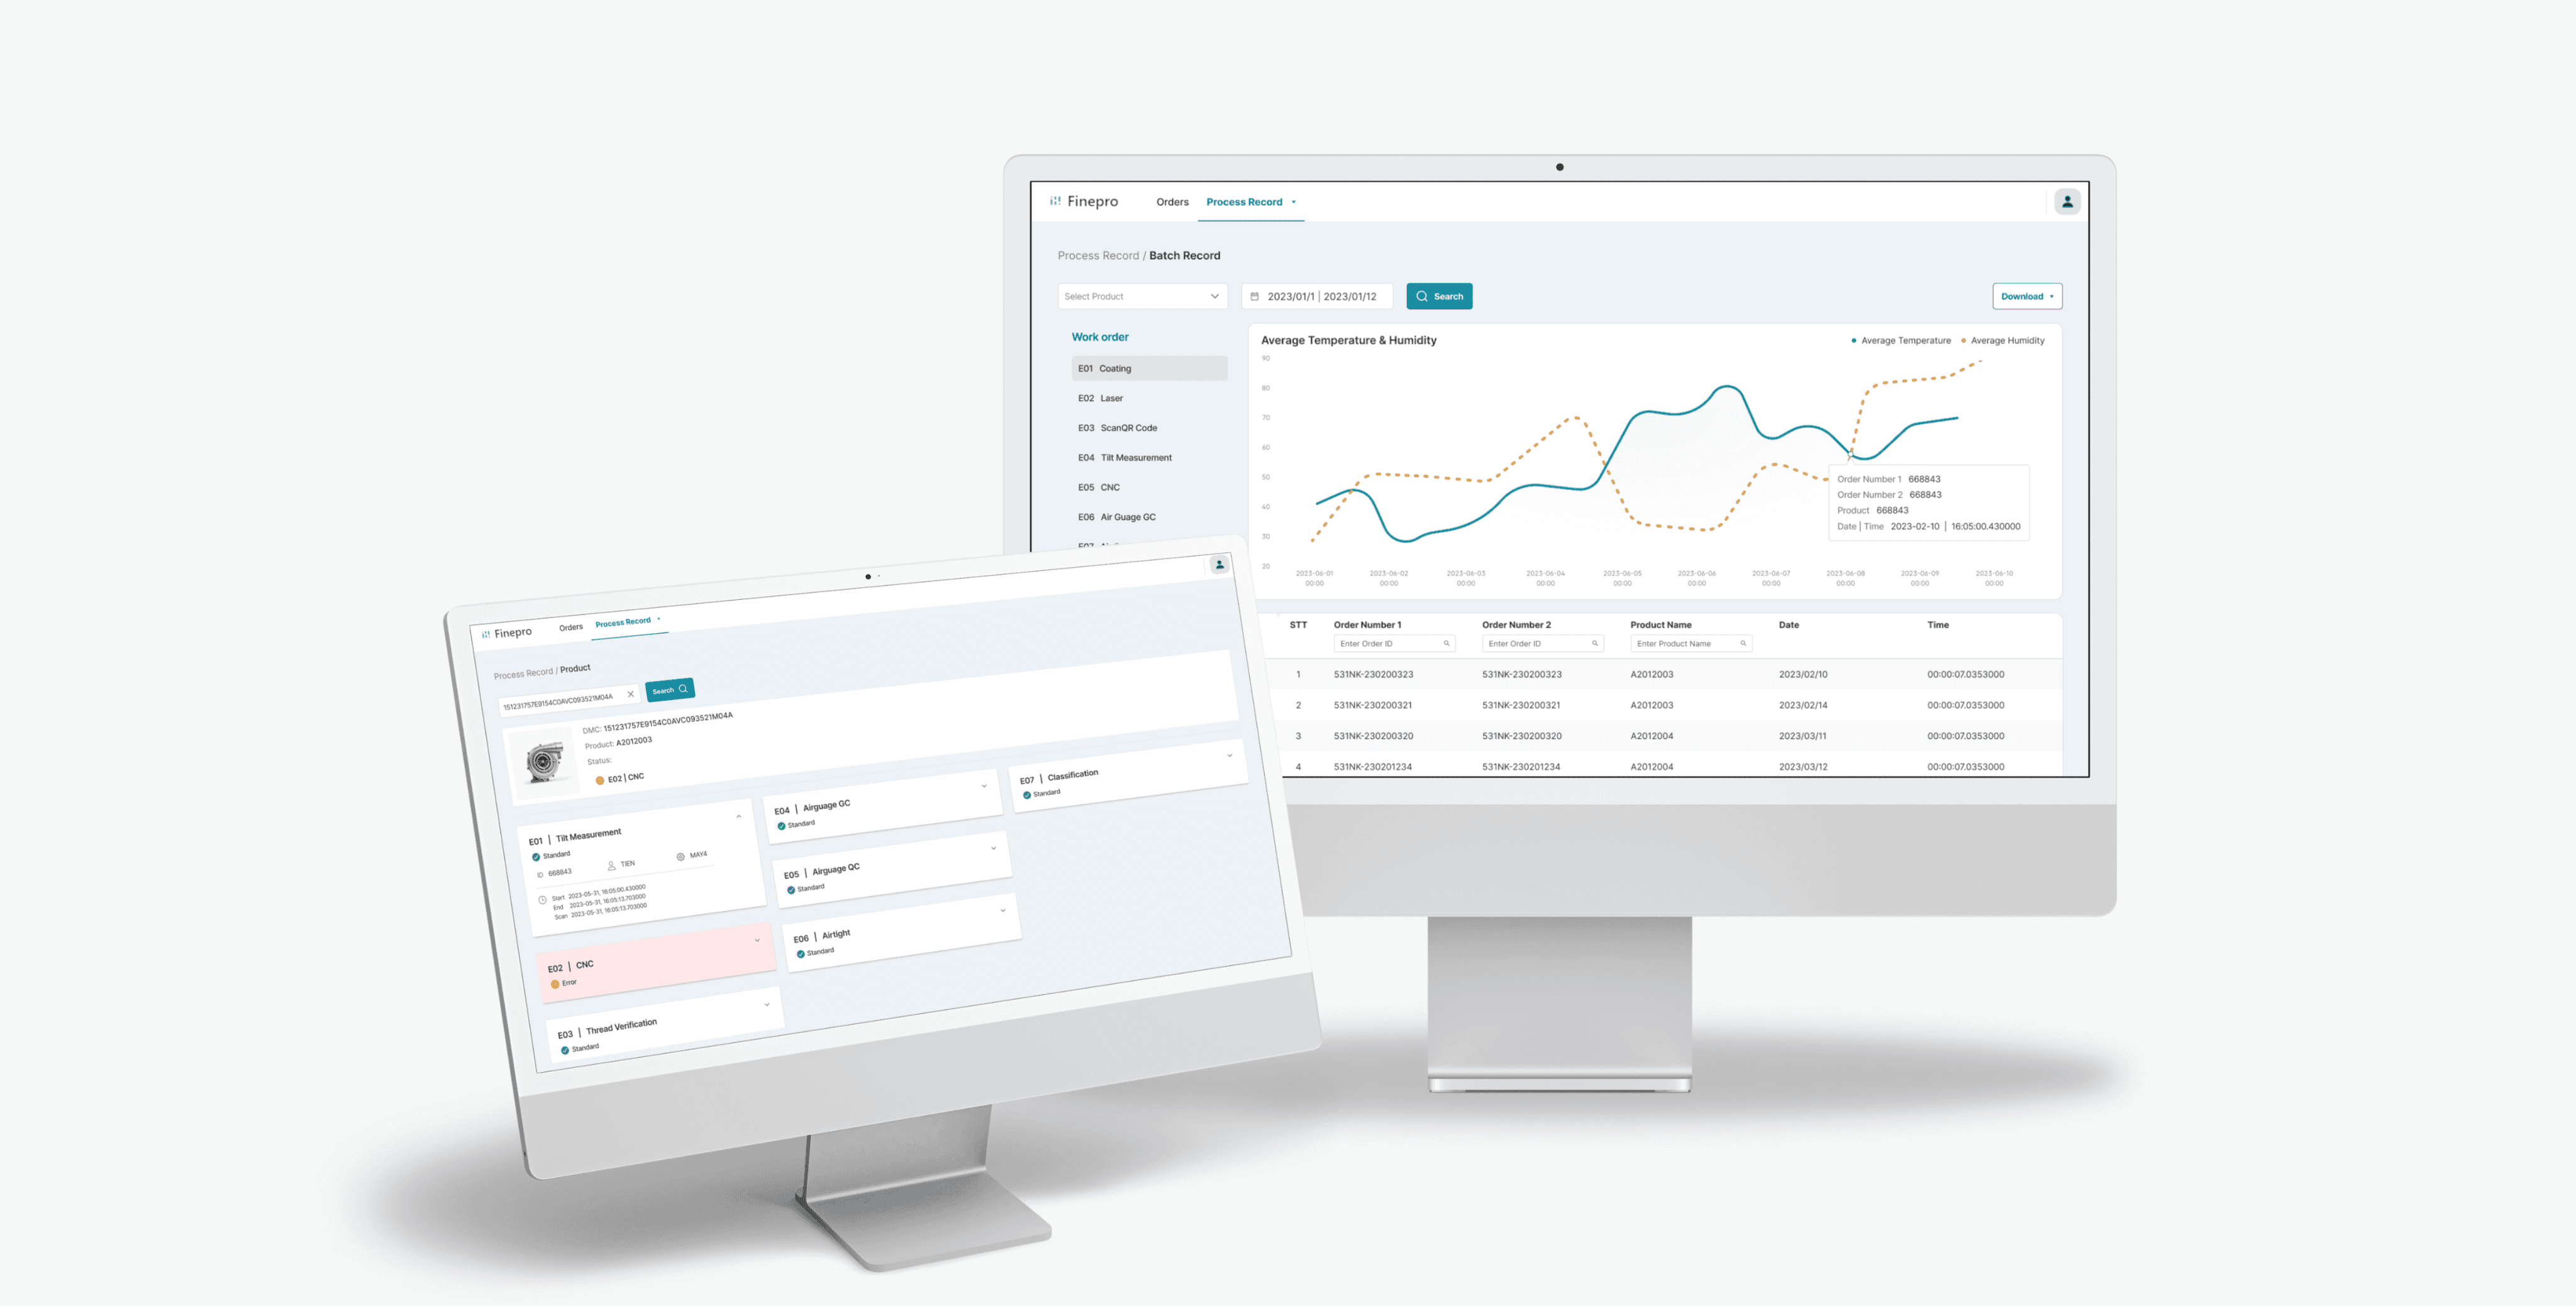
The internal production tracing tool is originally used by internal workers to retrieve production data for specific product and procedure. However, the current system has critical usability issues, resulting in low efficiency within the work flow . Moreover, the system is not meeting the latest business objectives and use case.

DISCOVERY - PRODUCT AUDIT

DISCOVERY - PRODUCT AUDIT

Look into the Tool - Information Architecture X User Flow

Look into the Tool -

Information Architecture

X User Flow

I started by conducting product audit to identify pain points in the existing internal system. I requested access to the live tool and analyzed it with a focus on information architecture, navigation patterns, and user flows to uncover areas of friction.

Identify Main Tasks

Identify Main Tasks

I mapped out the sitemap to understand the system’s structure and identify key user tasks. From there, I created task-specific user flows to analyze how users currently navigate the system and identify usability gaps.
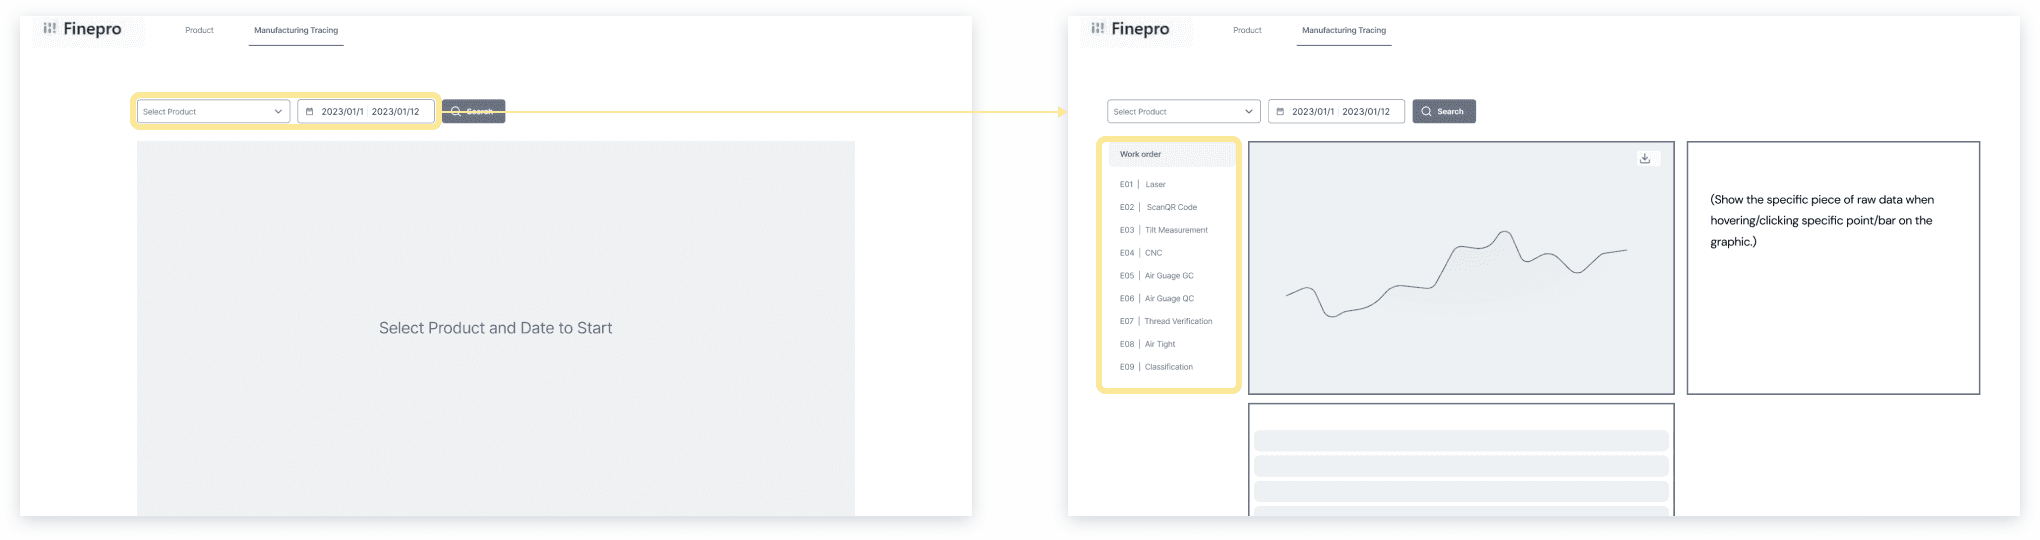
Original Sitemap

Original Sitemap

TASK 1

View overview data table for selected product

View overview data table for selected product

Lack of clear entry point

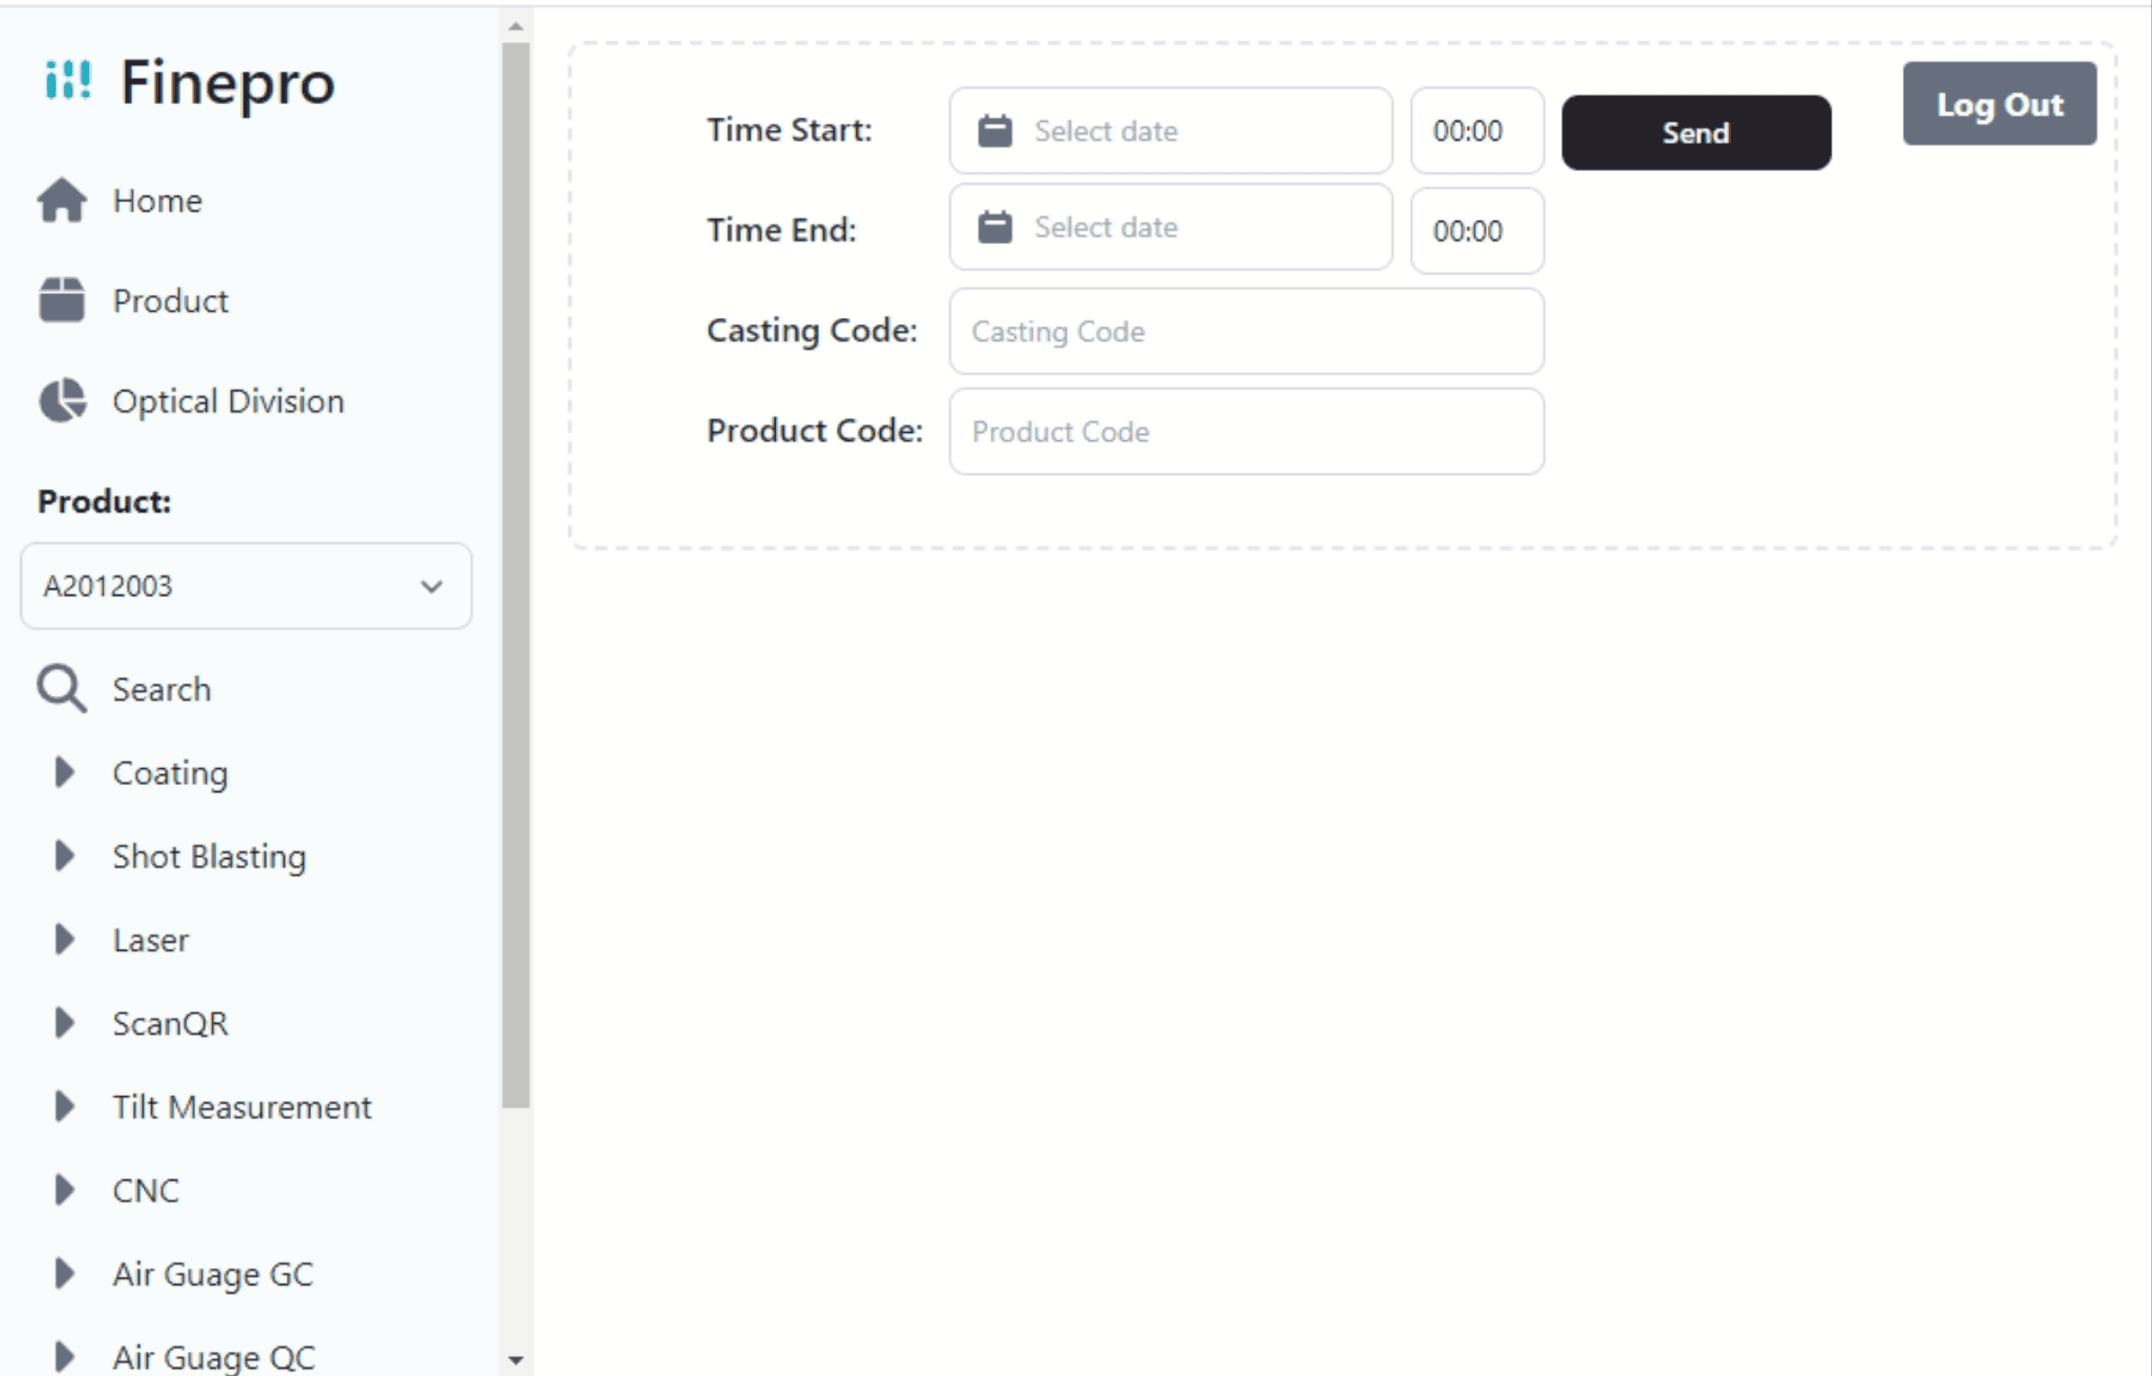
Users need a clear entry point. On first interaction with the tool, I found the input fields on the main page (e.g., Time Start, Time End) and the side navigation labels confusing and overwhelming.

Redundant action needed

After selecting a product, users must either click ‘Search’ or select a work order below to proceed—but the system provides no clear indication that an additional action is required. This lack of guidance can lead to confusion and interrupt task flow.

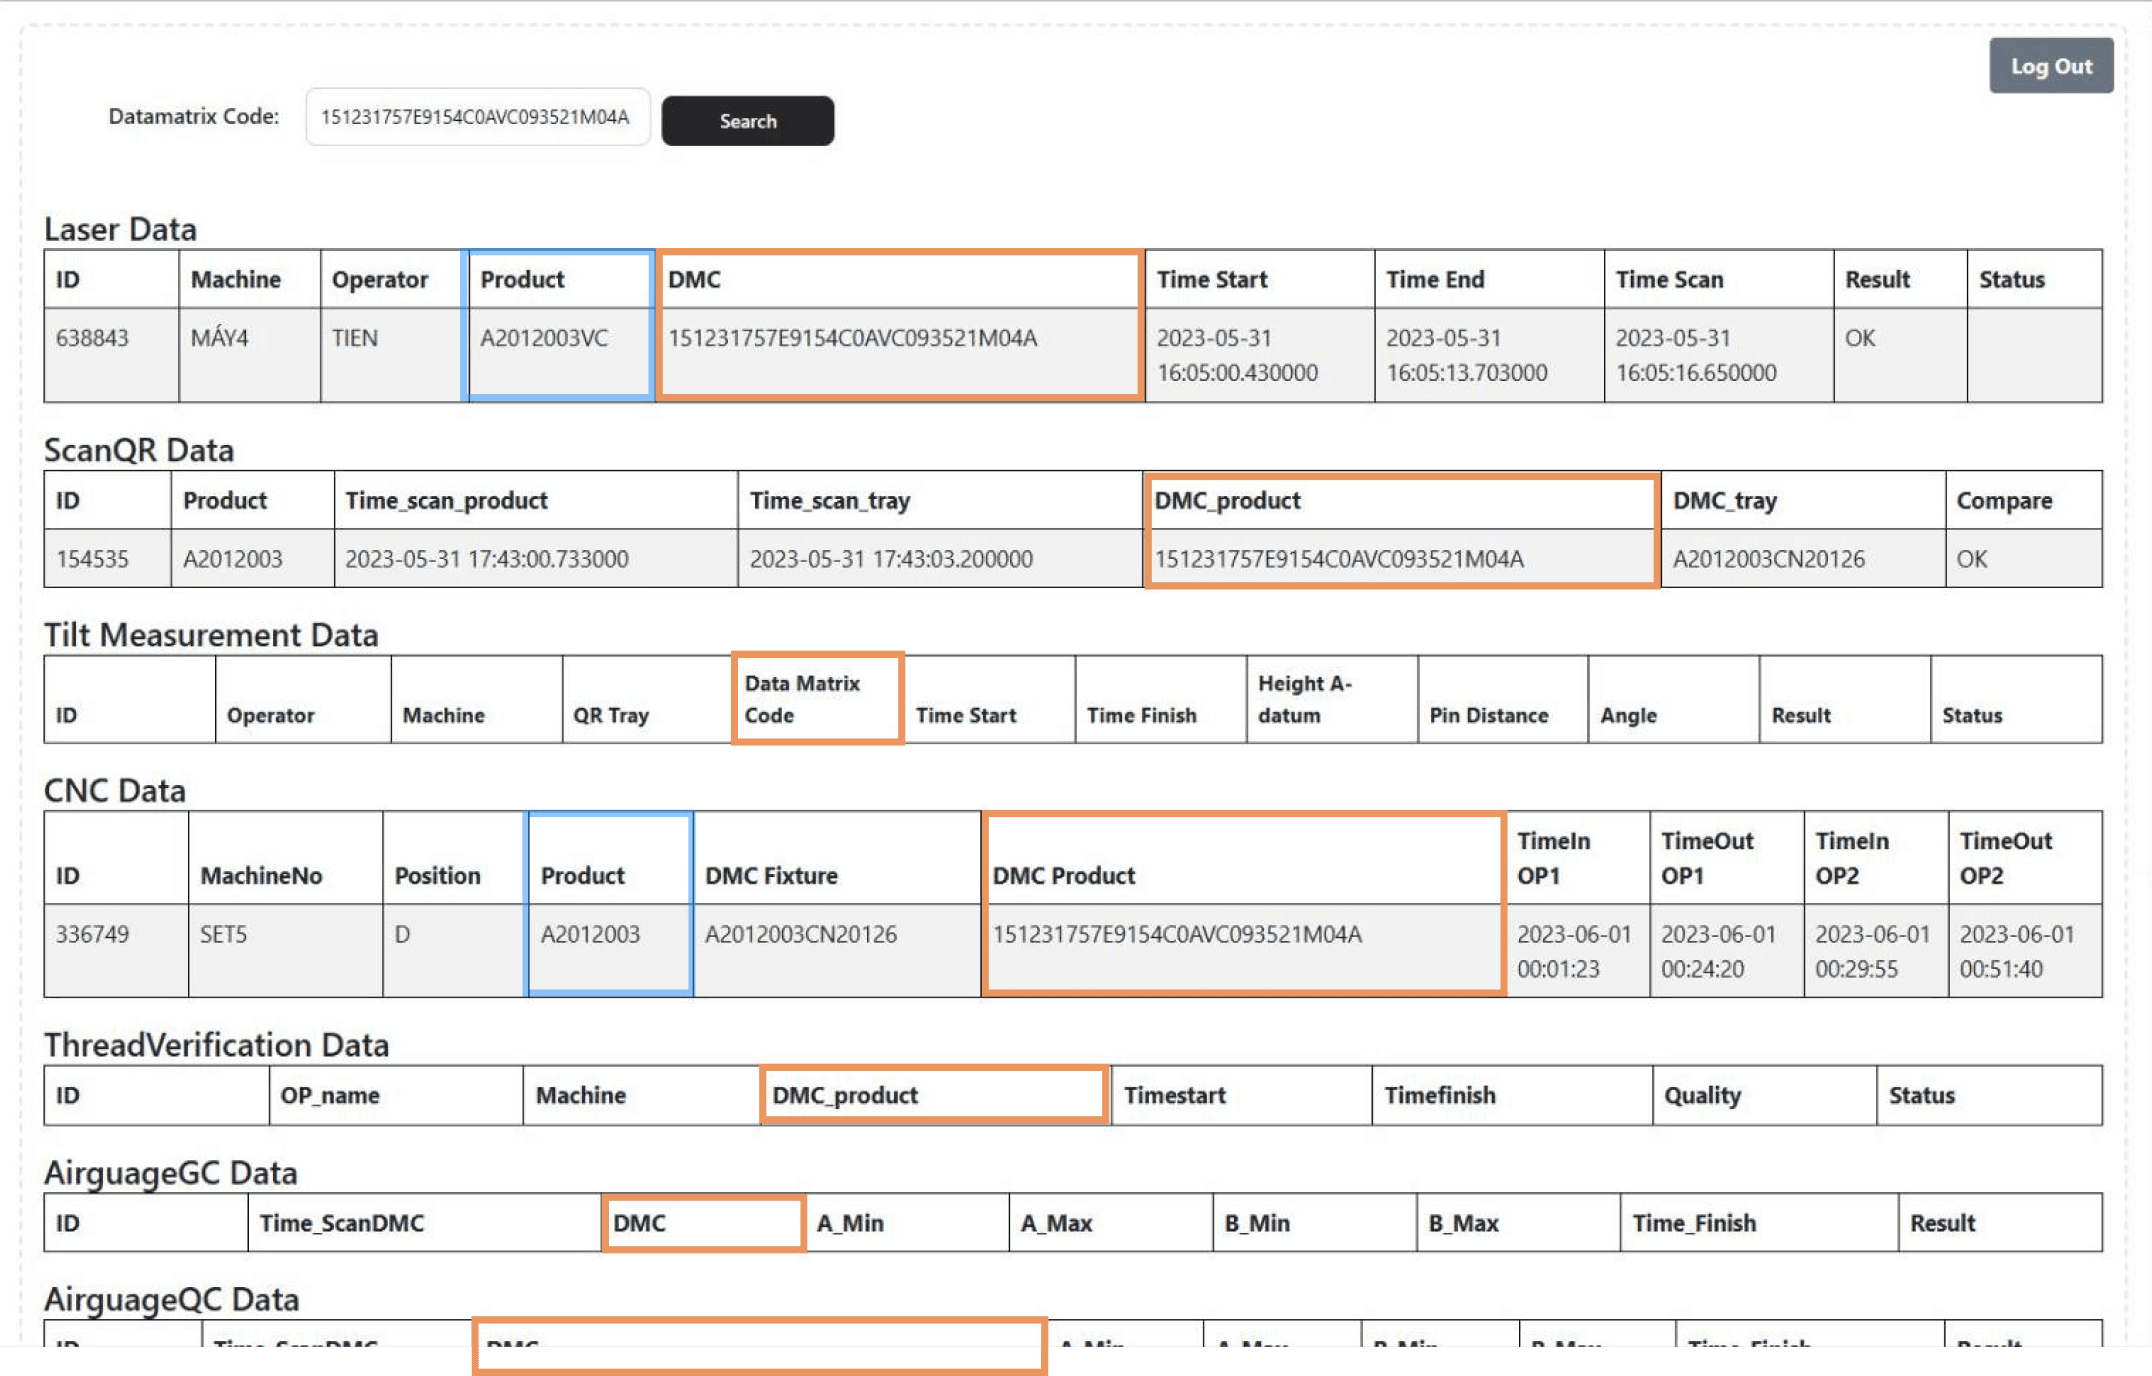
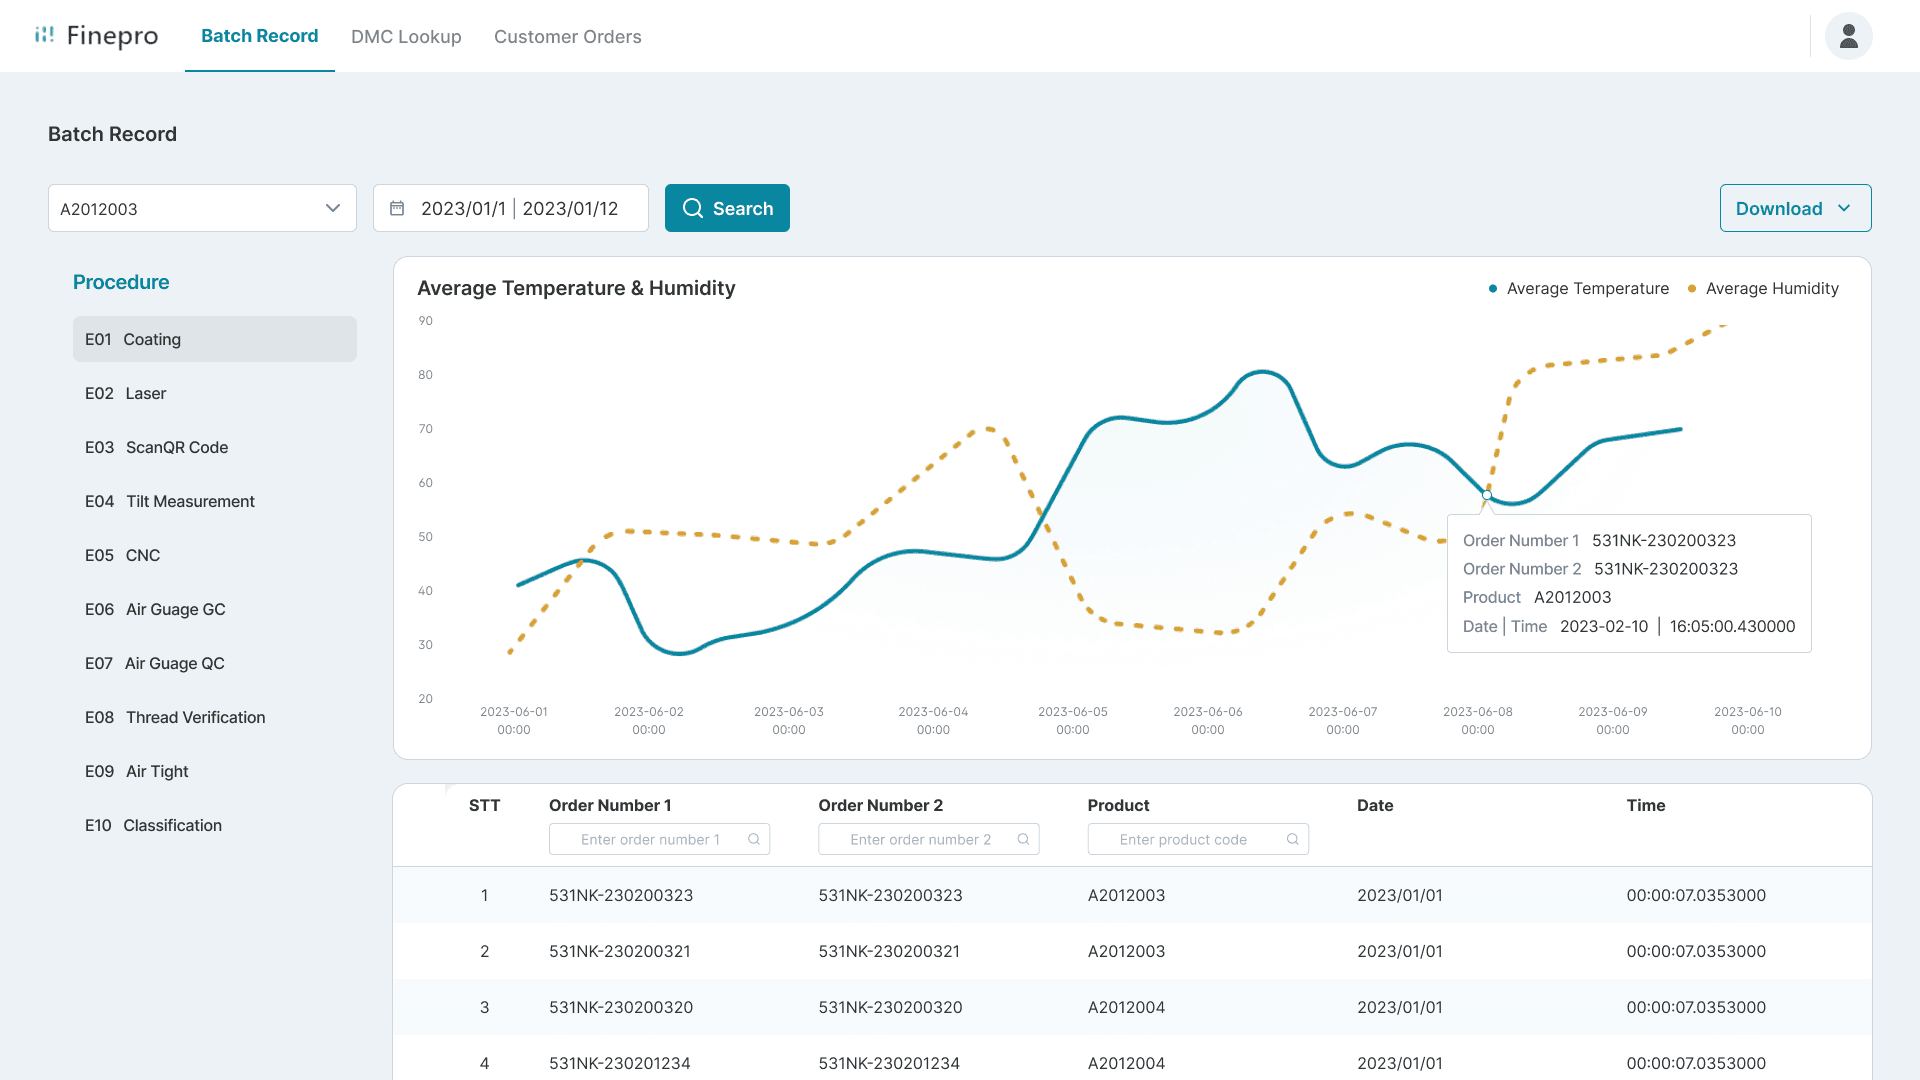
Poor readability in data table

It’s difficult for users to efficiently read and identify key information in a long table with many rows and columns. Additionally, repeated labels for each procedure are inconsistently placed across the rows.
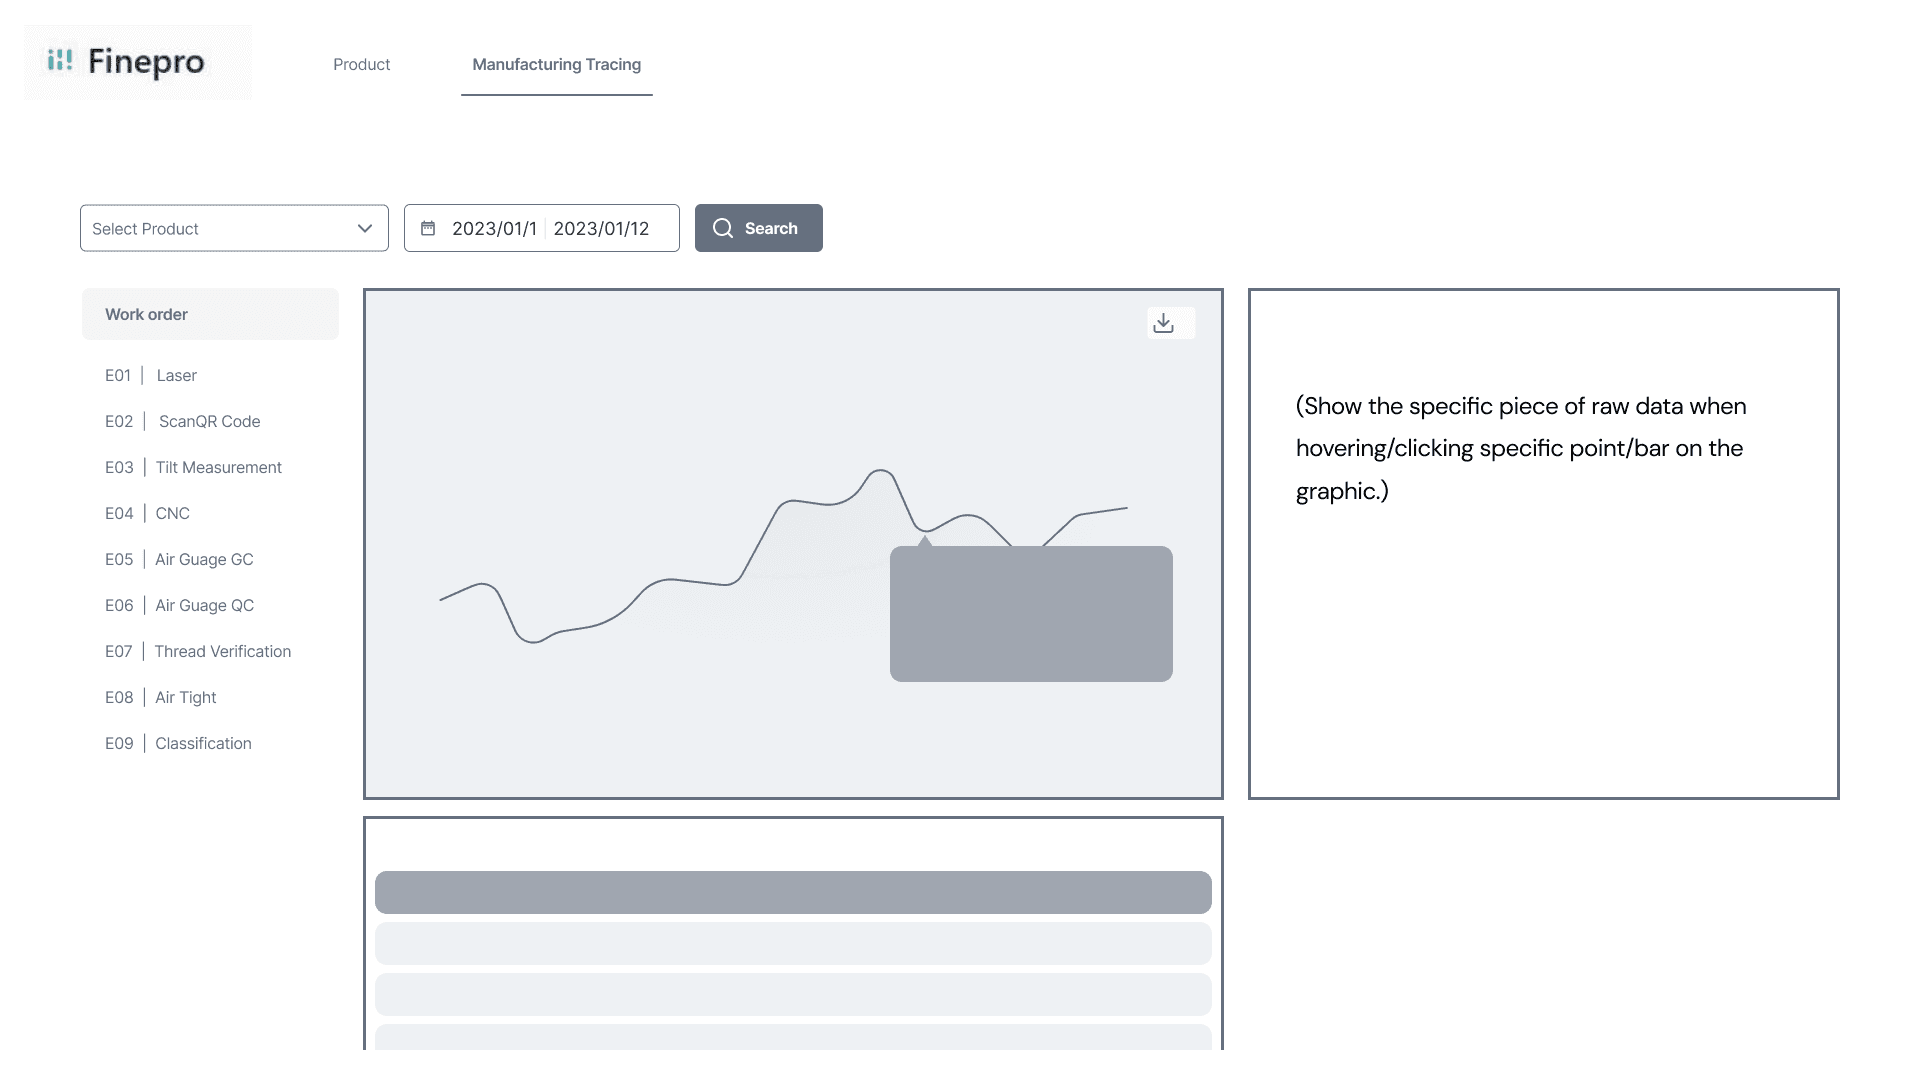
TASK 2

Access graphic and detailed data for selected procedure

Access graphic and detailed data for selected procedure

Lack of clear entry point

Similar as the previous task, users need a clear entry point.

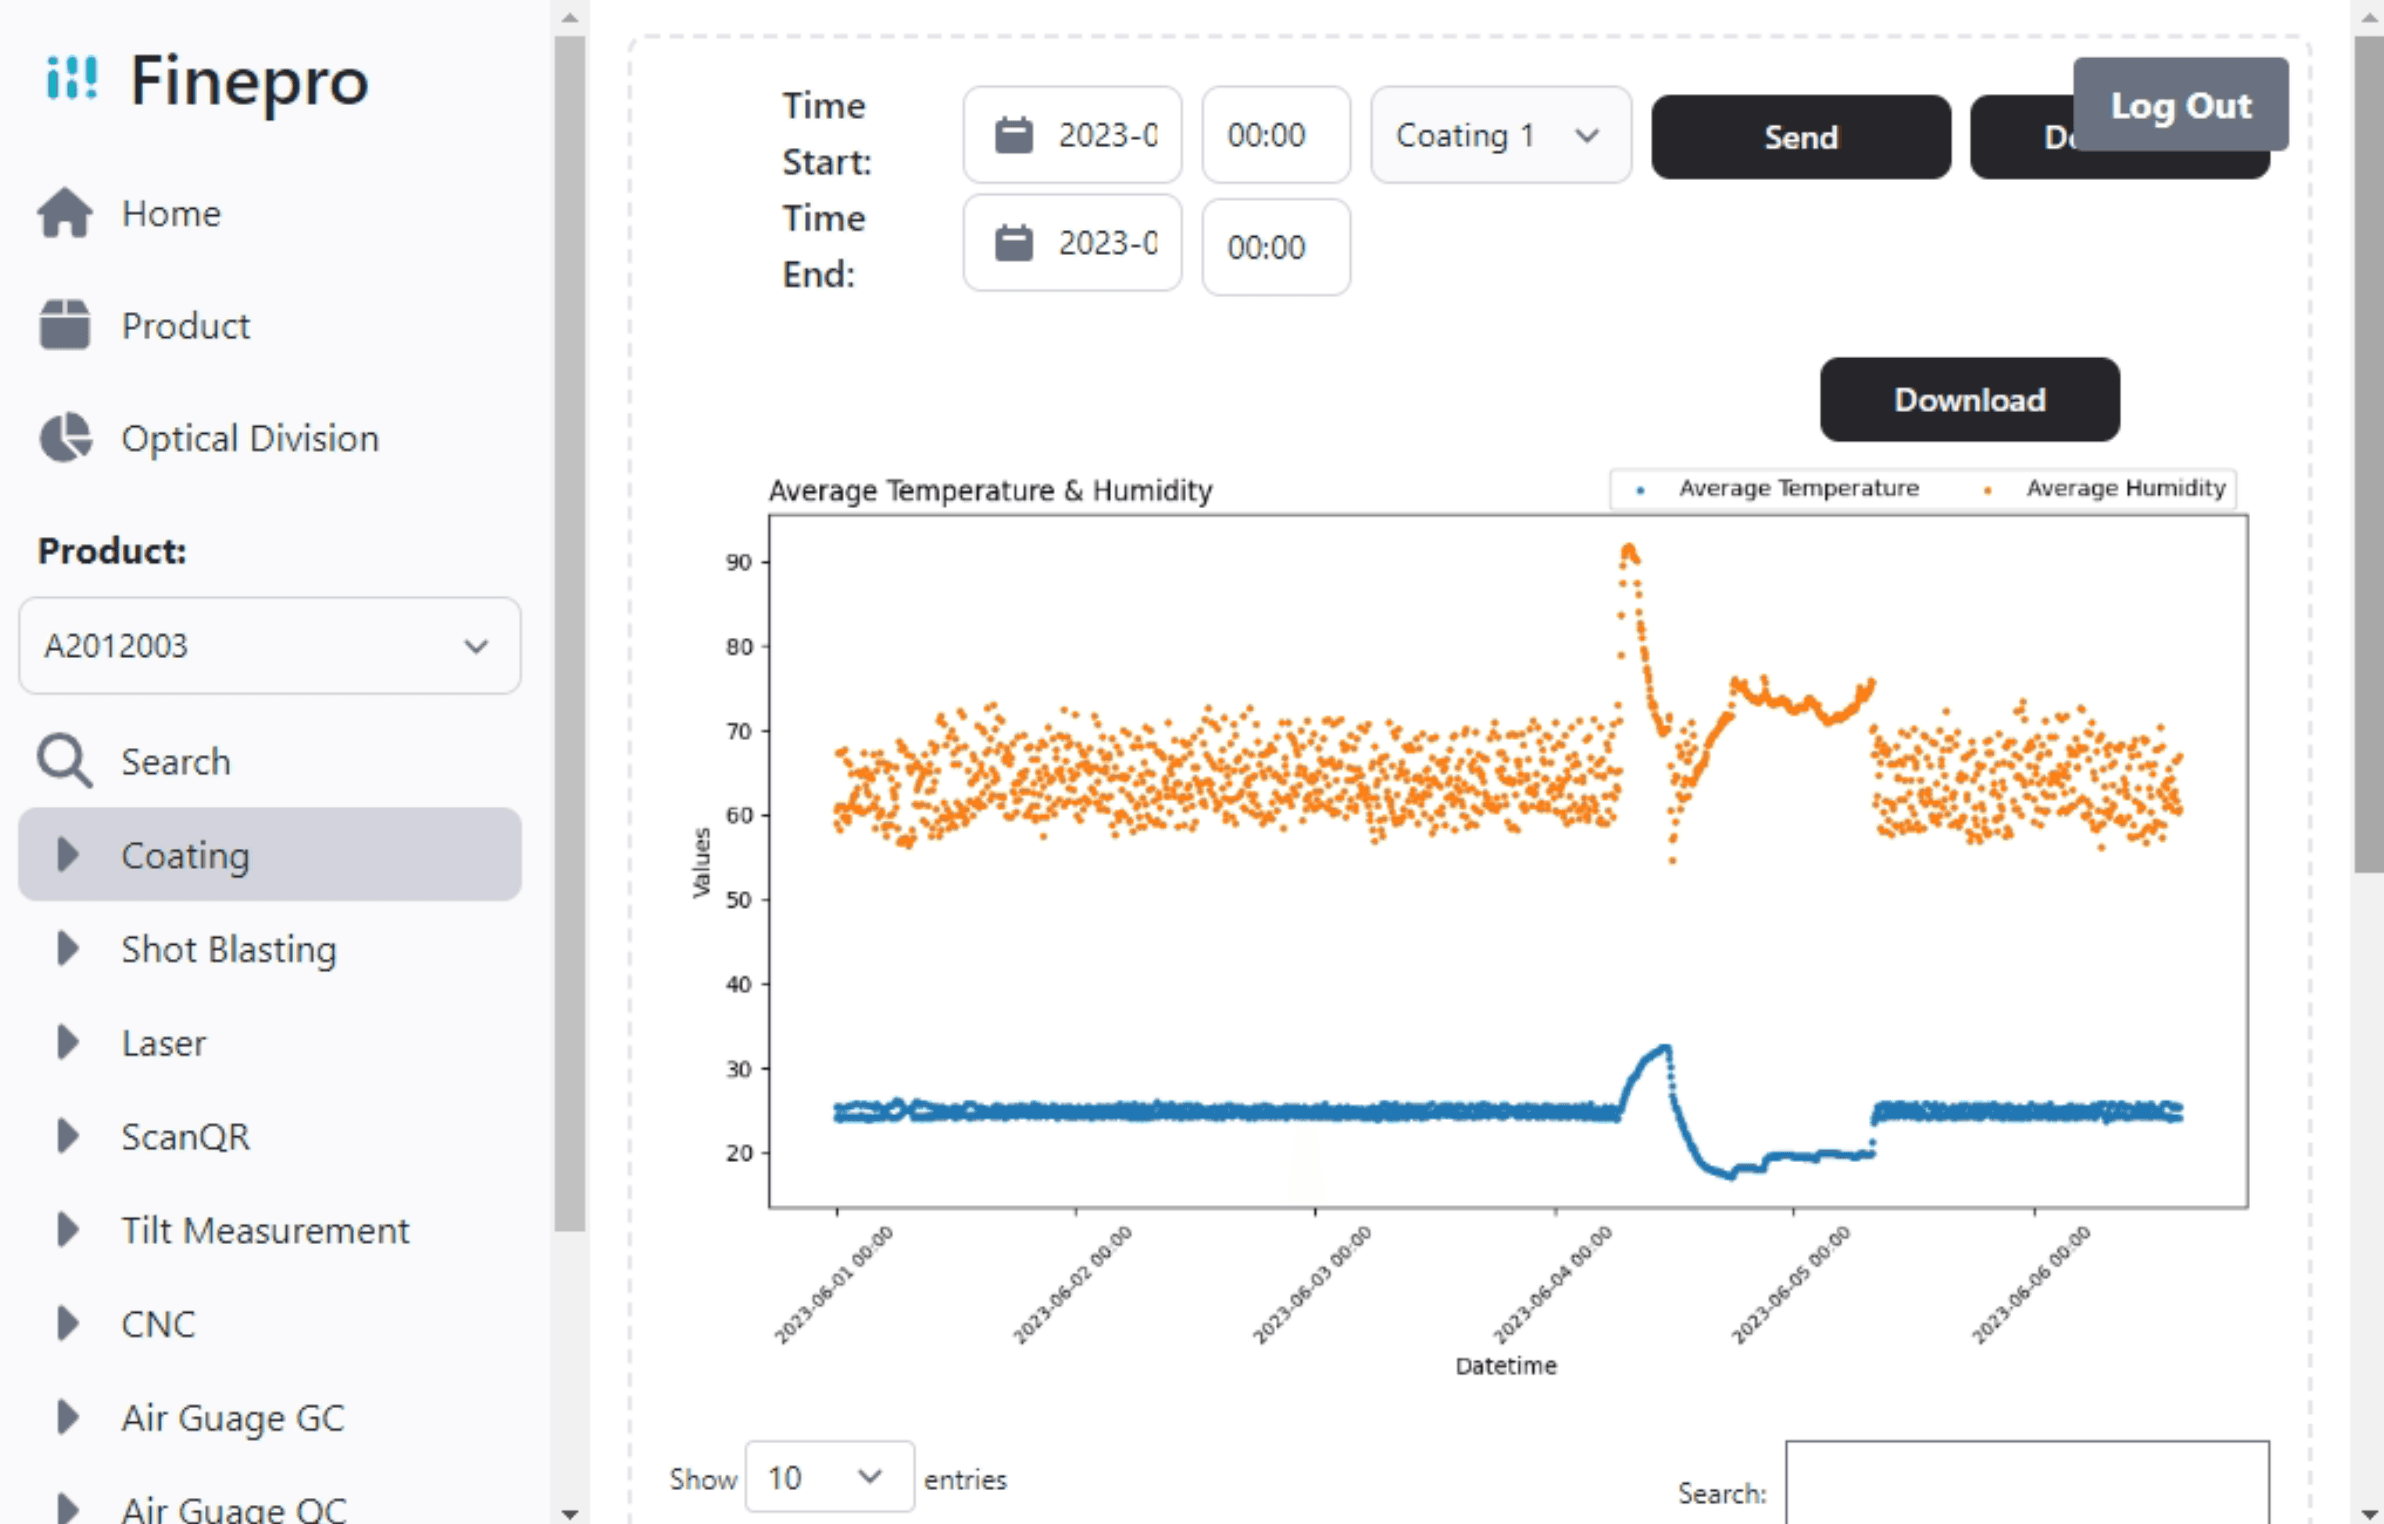
Weak integration between graph and data

There’s an opportunity to strengthen the connection between the graph and the raw data below, helping users interpret both more effectively together.

From Usability Insights to Design Decisions

01

How might we redesign navigation to make production data retrieving process more intuitive?

Users need a clear entry point, where they may find the input fields on the main page (e.g., Time Start, Time End) and the side navigation labels confusing and overwhelming.

DESIGN SOLUTION

Clarify the purpose, input, and outcome for two data retrieving tasks

I reached out to PM and stakeholders for clarifying how workers complete two manufacturing tracing tasks, what’s the purpose, and what inputs are needed to retrieve desired result.

Given that the inputs and outcome for two tasks are different, I decided to design them into separate page:

TASK 1

DMC Lookup - Input ‘Data matrix code (DMC)' to track the data table for specific product

Stakeholder Insight:

Supporting Manual and Scan-Based DMC Entry

Stakeholders emphasized the need for dual input methods to support diverse workflows—users should be able to input DMC codes either manually or via a scanner.

TASK 2

Filter by procedure & time period to find abnormal production through the graph and raw data

For retrieving data for product batches, users should first search by product. Then, filter the time duration to get closer to the data they're searching for. Then, users can switch between different work orders to view respective graphic and raw data.

02

How might we redesign data presentation for the internal staff to identify and interpret the data more efficiently?

It's hard for users to efficiently read and identify key information through the poor organized data table, and find key connection between graphs and raw data.

DESIGN SOLUTION

Enhancing Readability and Error Visibility with Card View & Color Signals

I designed a card view for presenting data by procedure to enhance readability and reduce long scrolling. Each card displays key information in a standardized format—such as ID, machine, operator, and time—which frequently appears across procedures. Users can expand cards to view additional details as needed, making it easier to scan and compare information efficiently.

Before

Wireframe

Hi-Fi

DESIGN SOLUTION

Enhance connection and interaction between the graph and the raw data

Before

After

Wireframe

Hi-Fi

Build connection between graph and raw data for better interpretation

To efficiently spot abnormalities in the graph, users can hover over a data point and click to view the corresponding raw data in focus.

Design for External Client Order Tracking

USER FLOW

USER FLOW

Map out user flow for two scenarios

DESIGN SOLUTION

Clarify the purpose, input, and outcome for two data retrieving tasks

I reached out to PM and stakeholders for clarifying how workers complete two manufacturing tracing tasks, what’s the purpose, and what inputs are needed to retrieve desired result.

Given that the inputs and outcome for two tasks are different, I decided to design them into separate page:

Emphasize status with position and color

I decided to place the status to the first left column, where users mostly start reading with. I also apply colors to different status, so that they can skim to see if there's order not meeting standards.

High-Fidelity Prototype

Final Design

Lookup DMC for product record

Lookup DMC for product record

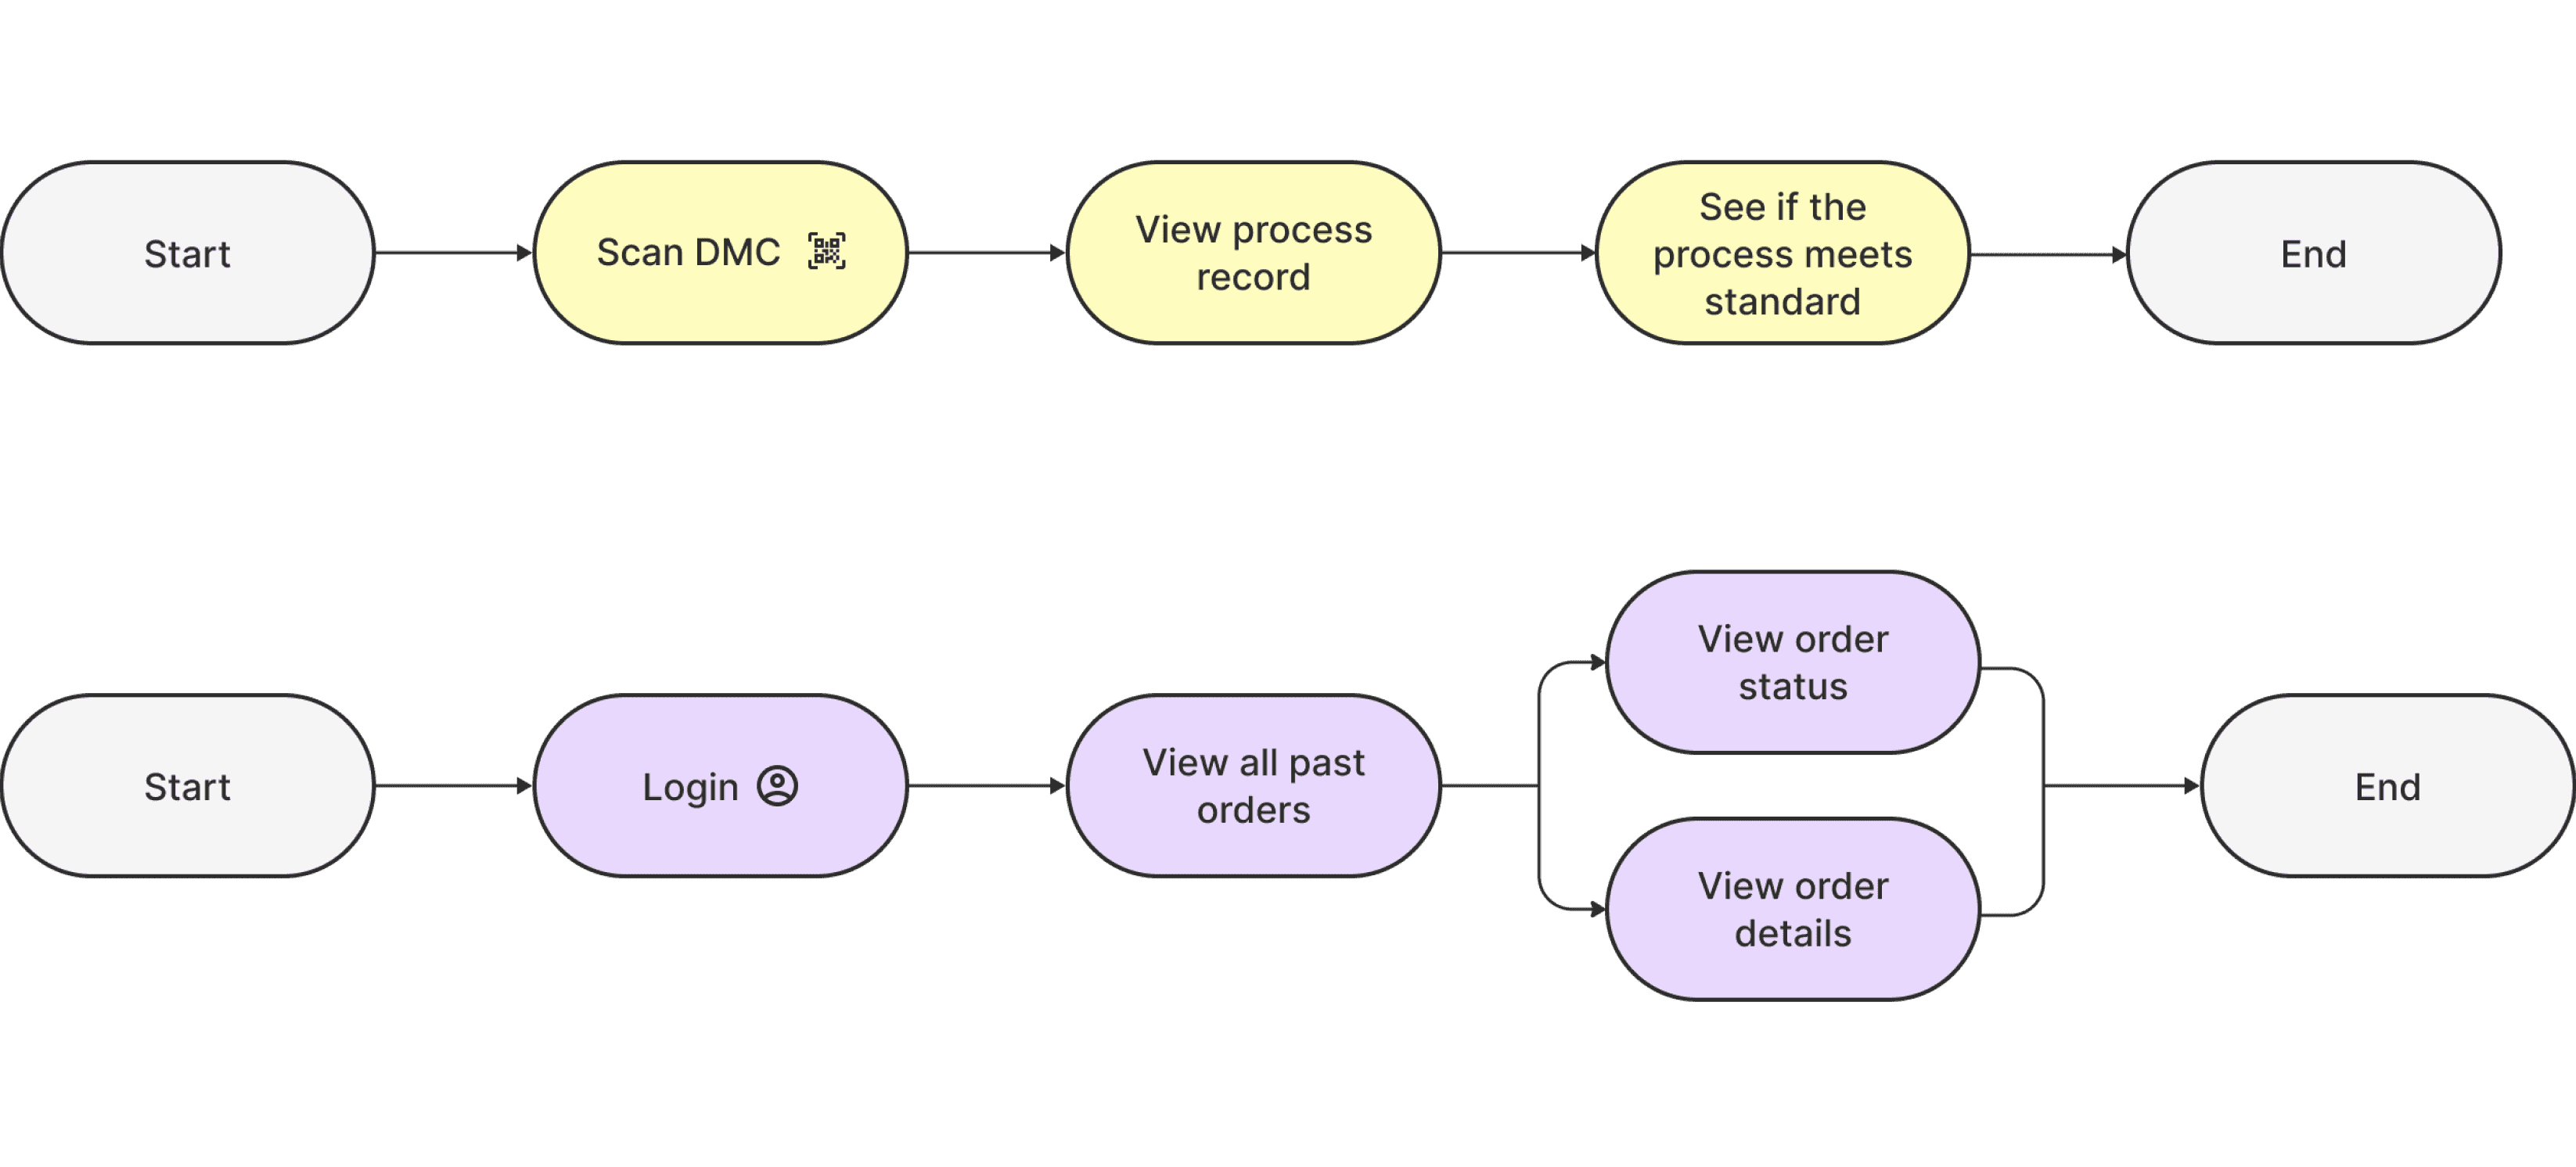
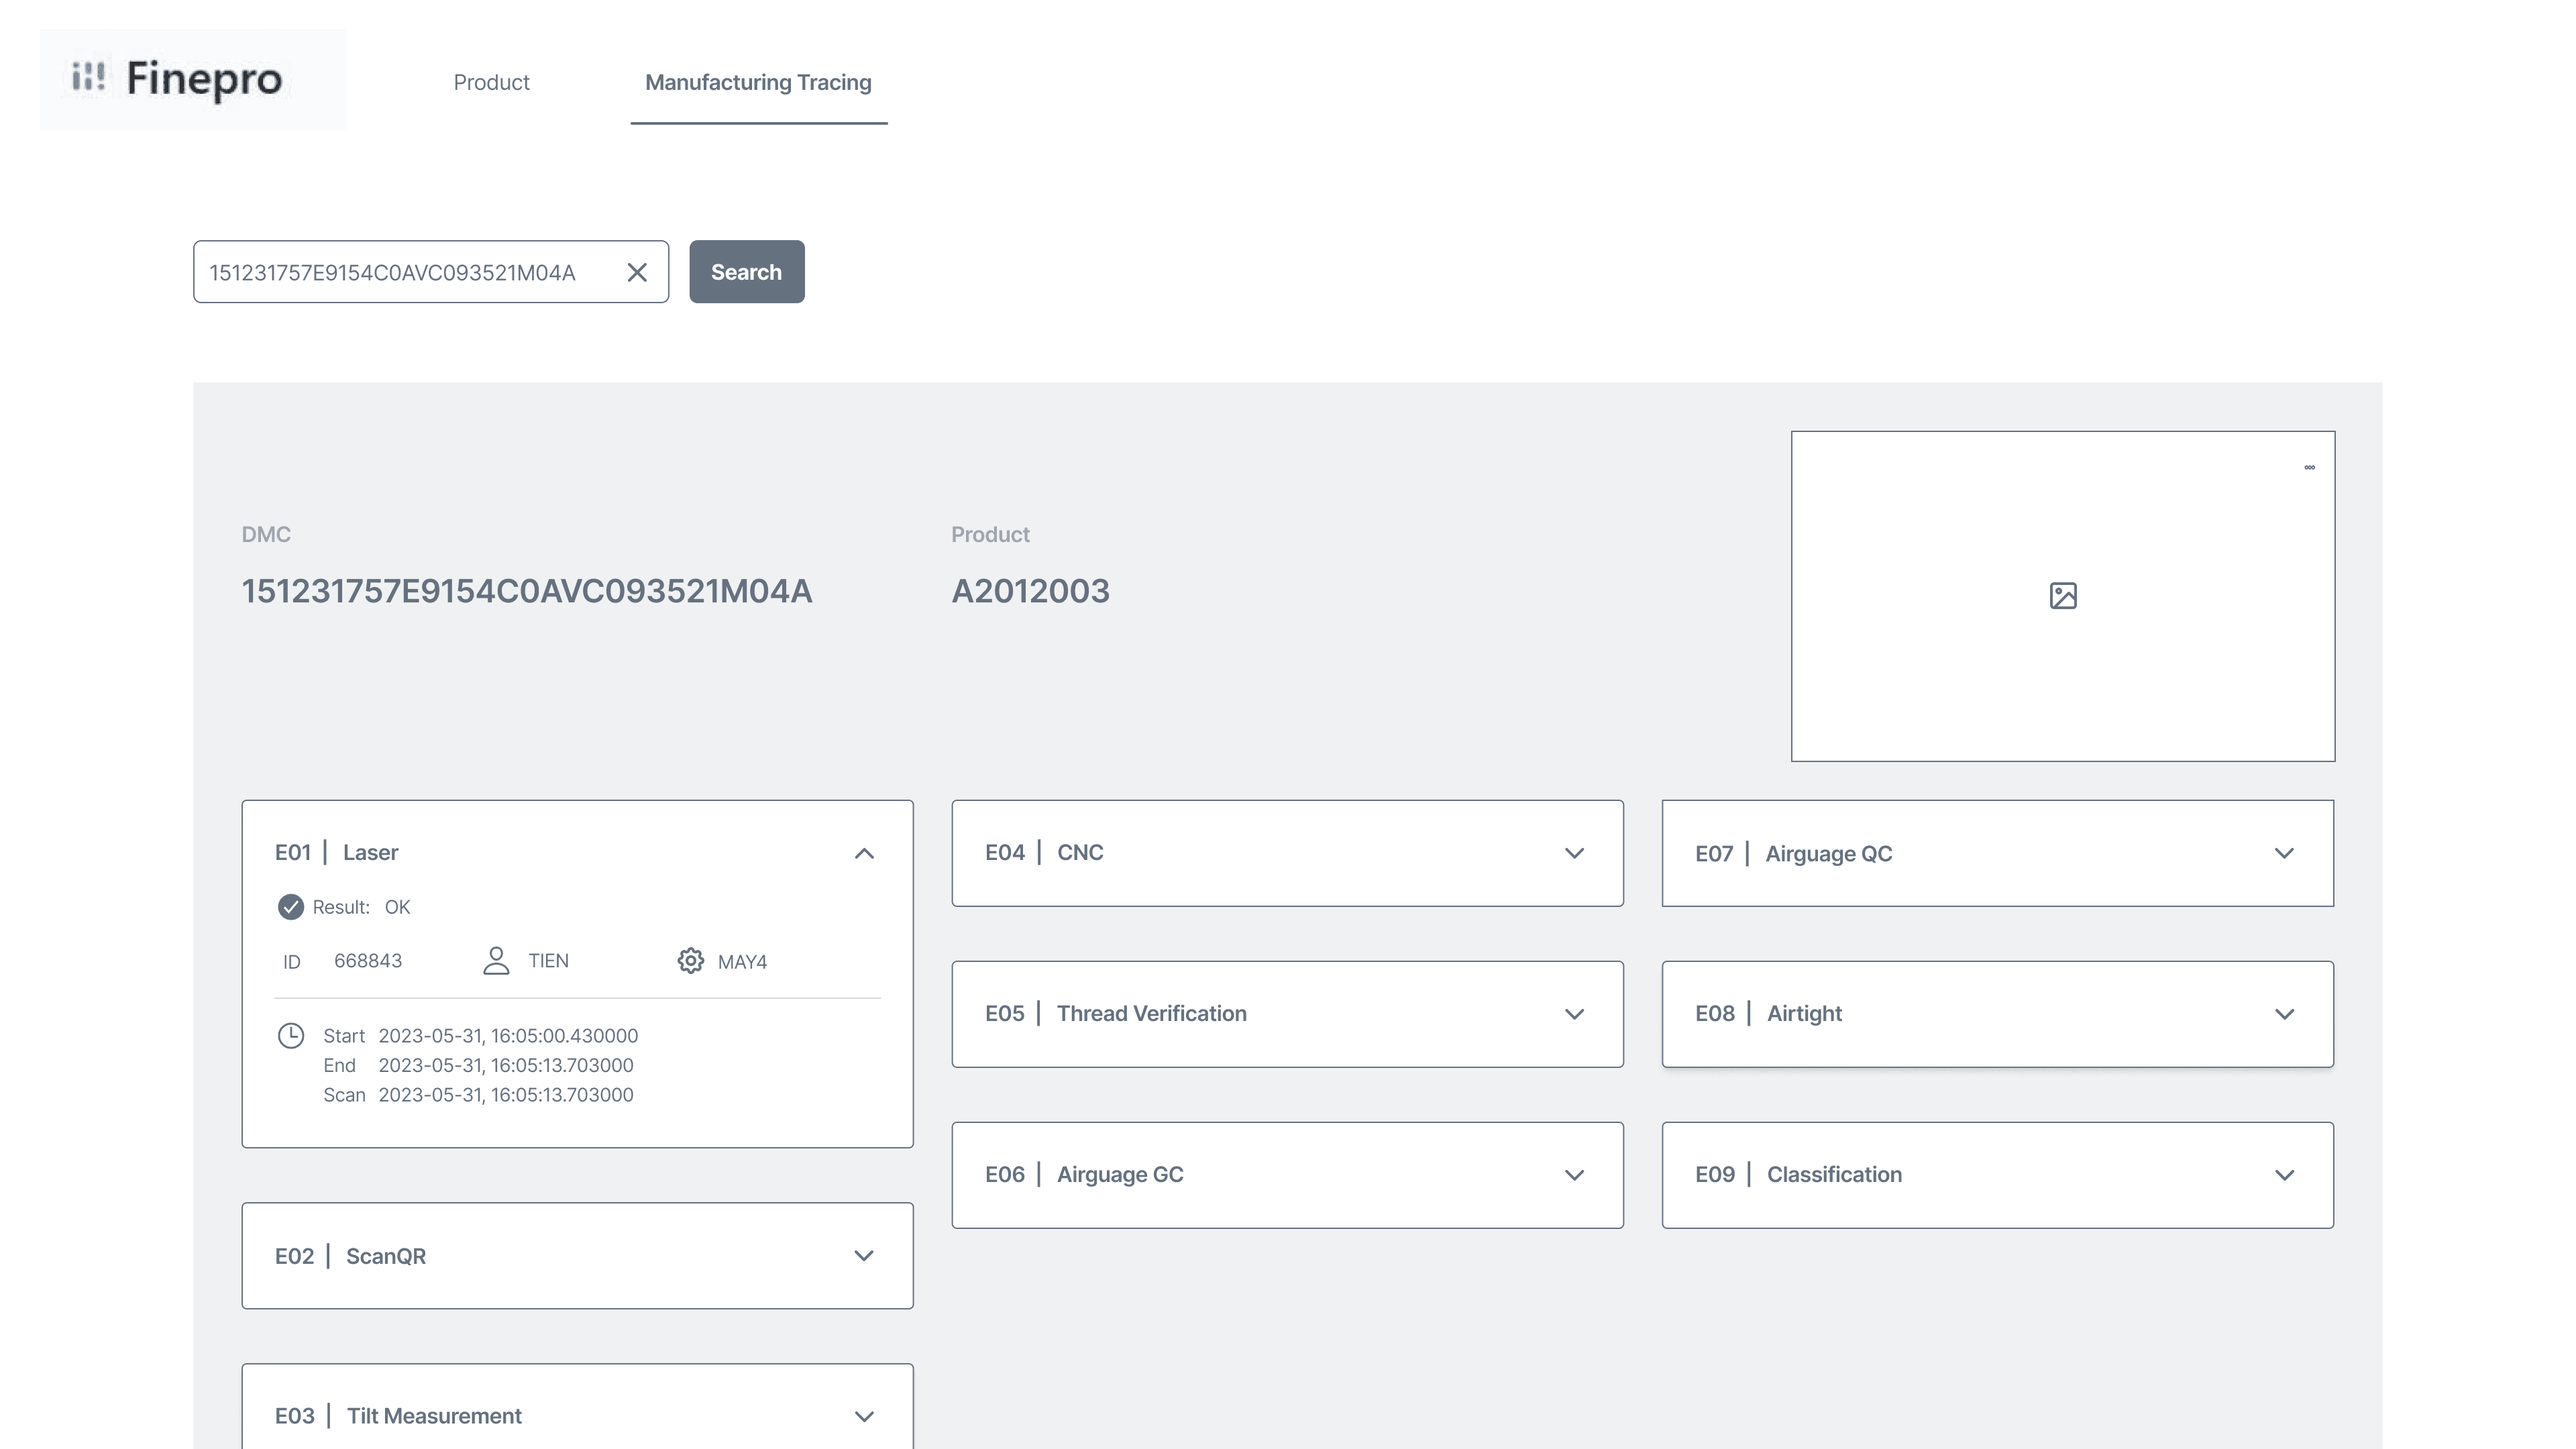
Internal staff can look up individual product's production data through entering the DMC (Data Matrix Code) manually or using the DMC scanner.

View batch records for a selected product within a specific time frame

View batch records for a selected product within a specific time frame

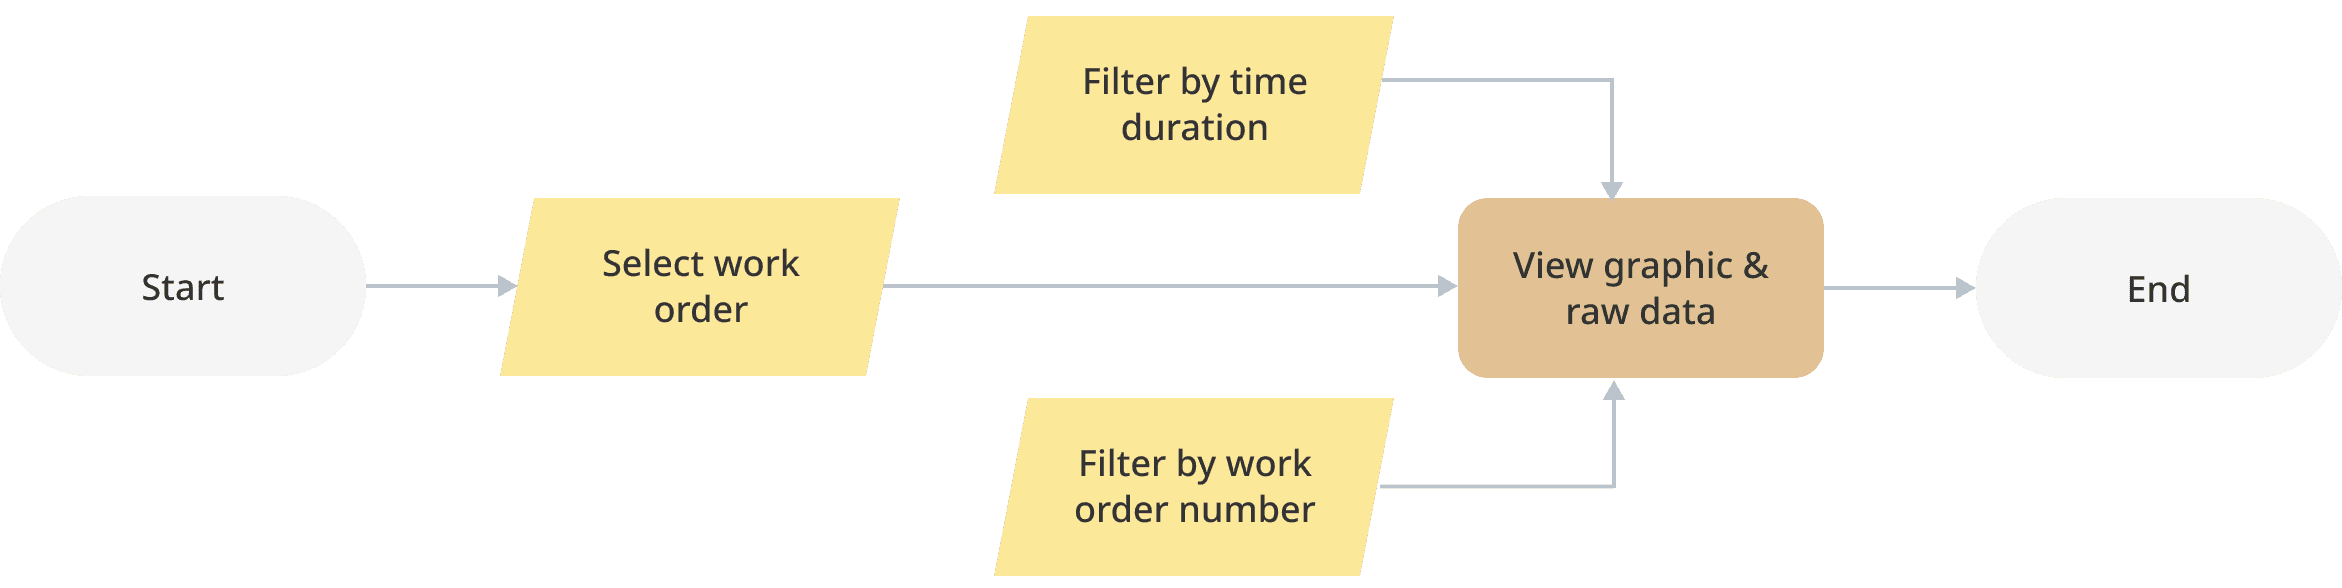
Internal staff can retrieve graph and raw data for past production record. The goal is to retrieve data for abnormalities within the production process.
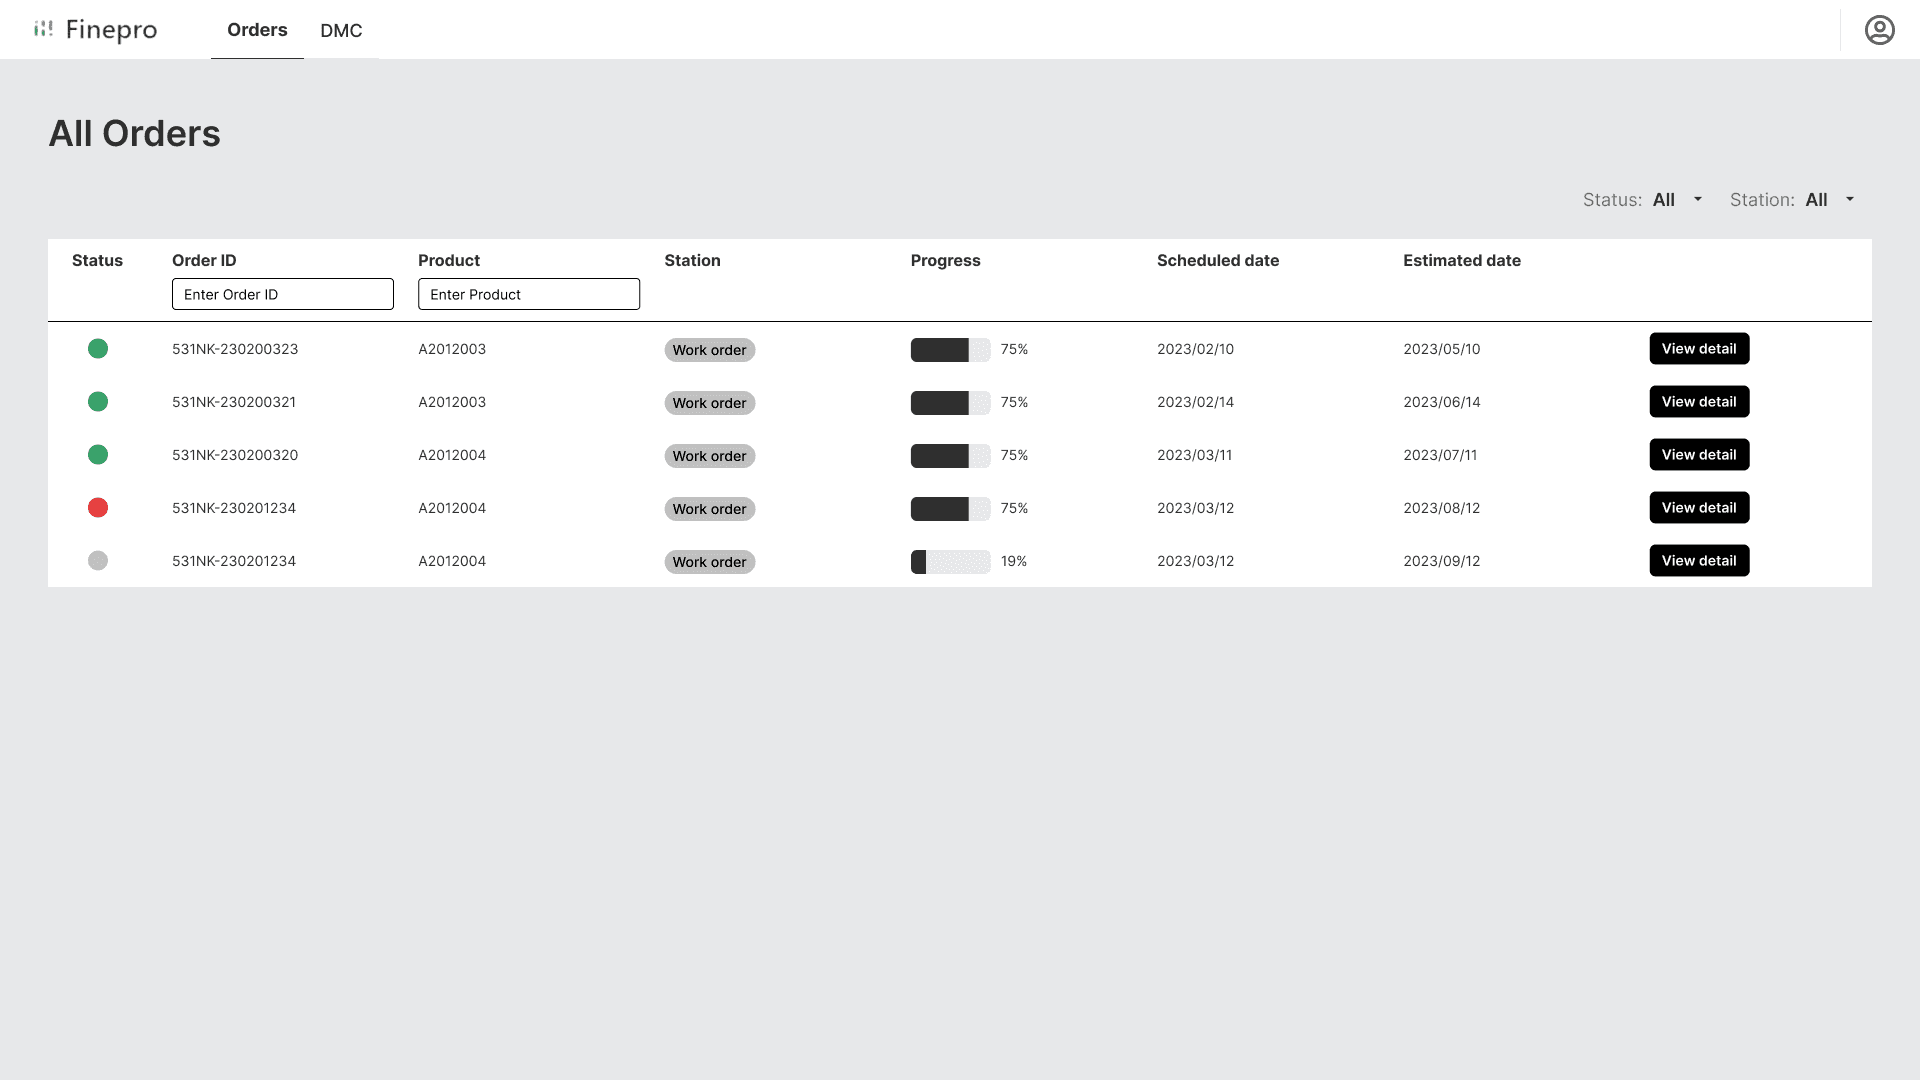
Check Order Status

Clients want to know if the orders are produced to standards, and what process they're on.

Design System

Final Design

Next Steps

Next Steps

Finalizing Client-Side Flow and Design Details with Stakeholders

Adjust UI for Scalability to Handle Dynamic Data and Edge Cases

Due to time constraints, I was unable to complete the entire project. If given the opportunity to continue, I would collaborate with stakeholders to finalize the client-side order viewing flow, for which I have not yet gathered sufficient details. Additionally, I would work on completing other key elements—such as integrating the DMC scanner into the workflow and refining UX writing, including the use of industry-specific terminology.

Make sure the design is scalable for edge cases. For example, make sure the placeholders adapt to all the possible length of data inputs. Moreover, for each work order card, confirm with the engineers for specific data fields needed and design customized cards accordingly.

Working with Engineers to Ensure Design Align with Back-End Data

Adjust UI for Scalability to Handle Dynamic Data and Edge Cases

It’s important to consider back-end side when it comes to designing for manufacturing SaaS, mostly founded on complex data. For example, make sure the placeholders are designed to be responsive for all the possible length of data. Moreover, for each work order card, confirm with the engineers for specific data fields needed and design customized cards accordingly.

Make sure the design is scalable for edge cases. For example, make sure the placeholders adapt to all the possible length of data inputs. Moreover, for each work order card, confirm with the engineers for specific data fields needed and design customized cards accordingly.

Collect Usage Data after Launch

Collect Usage Data after Launch

Due to time limitation, I was not able to test the high-fidelity prototype. If I have time and contact resource to end users, I would do usability testing to observe how the design is used in real-world scenario, allowing me to identify usability issues and potential bottlenecks.


Moreover, it’s critical to collect usage data to validate if the design truly solve users’ problems. I will focus on :

  • How users interact with the design?

  • What features are helping, and what’s not?

  • How users satisfy with the product and the overall experience?

Explore more projects

Explore more projects

Explore more projects

Let's connect and collaborate!

Let's connect and collaborate!

Let's connect and collaborate!